Method Call Recording
Recording method calls is is one of the most difficult tasks for a profiler, because it operates under conflicting constraints: Results should to be accurate, complete and produce such a small overhead that the conclusions you draw from the measured data do not become incorrect. Unfortunately, there is no single type of measurement that fulfills all these requirements for all types of applications. This is why JProfiler requires you to make a decision on which method to use.
Sampling versus instrumentation
Measuring method calls can be done with two fundamentally different techniques called "sampling" and "instrumentation", each of which has advantages and drawbacks: With sampling, the current call stacks of threads are inspected periodically. With instrumentation, the bytecode of selected classes is modified to trace method entry and exit. Instrumentation measures all invocations and can produce invocation counts for all methods.
When processing sampling data, the full sampling period (typically 5 ms) is attributed to the sampled call stack. With a large number of samples, a statistically correct picture emerges. The advantage of sampling is that it has a very low overhead because it happens infrequently. No bytecode has to be modified and the sampling period is much larger than the typical duration of a method call. The downside is that you cannot determine any method invocation counts. Additionally, short running methods that are called only a few times might not show up at all. This does not matter if you are looking for performance bottlenecks, but can be inconvenient if you are trying to understand the detailed runtime characteristics of your code.
Instrumentation, on the other hand, can introduce a large overhead if many short-running methods are instrumented. This instrumentation distorts the relative importance of performance hot spots because of the inherent overhead of the time measurement but also because many methods that would otherwise be inlined by the hot spot compiler must now remain separate method calls. For method calls that take a longer amount of time, the overhead is insignificant. If you can find a good set of classes that mainly perform high-level operations, instrumentation will add a very low overhead and can be preferable to sampling. JProfiler's overhead hotspot detection can also improve the situation after some runs. Additionally, the invocation count is often important information that makes it much easier to see what is going on.
Full sampling versus async sampling
JProfiler offers two different technical solutions for sampling: "Full sampling" is done with a separate thread that pauses all threads in the JVM periodically and inspects their stack traces. However, the JVM only pauses threads at certain "safe points" thereby introducing a bias. If you have highly multi-threaded CPU bound code, the profiled distribution of hotspots may be skewed significantly. On the other hand, if code also performs significant I/O, this bias will generally not be a problem.
To help with getting accurate numbers for highly CPU bound code, JProfiler also offers async sampling. With async sampling, a profiling signal handler is called on the running threads themselves. The profiling agent then inspects the native stack and extracts the Java stack frames. The main benefit is that there is no safe-point bias with this sampling method and the overhead for highly multi-threaded CPU bound applications is lower. However, only the "Running" thread state can be observed for the CPU views while "Waiting", "Blocking" or "Net I/O" thread states cannot be measured in this way. Probe data is always collected with bytecode instrumentation, so you will still get all thread states for JDBC and similar data.
Async sampling is only supported on Linux and macOS. Windows is not supported, because the operating system does not offer POSIX-style signal handlers.
Choosing a method call recording type
Which method call recording type to use for profiling is an important decision and there no right choice for all circumstances, so you need to make an informed decision. When you create a new session, the session startup dialog will ask you which method call recording type you want to use. At any later point in time you can change the method call recording type in the session settings dialog.

As a simple guide, consider the following questions that test whether your application falls into one of two clear categories on opposite sides of the spectrum:
Is the profiled application I/O bound?
This is the case for many web applications that wait on REST service and JDBC database calls most of the time. In that case, instrumentation will be the best option under the condition that you carefully select your call tree filters to only include your own code.Is the profiled application heavily multi-threaded and CPU bound?
For example, this could be the case for a compiler, image processing application or a web server that is running a load test. If you are profiling on Linux or macOS, you should choose async sampling to get the most accurate CPU times in this case.
Otherwise, "Full sampling" is generally the most suitable option and is suggested as the default for new sessions.
Native sampling
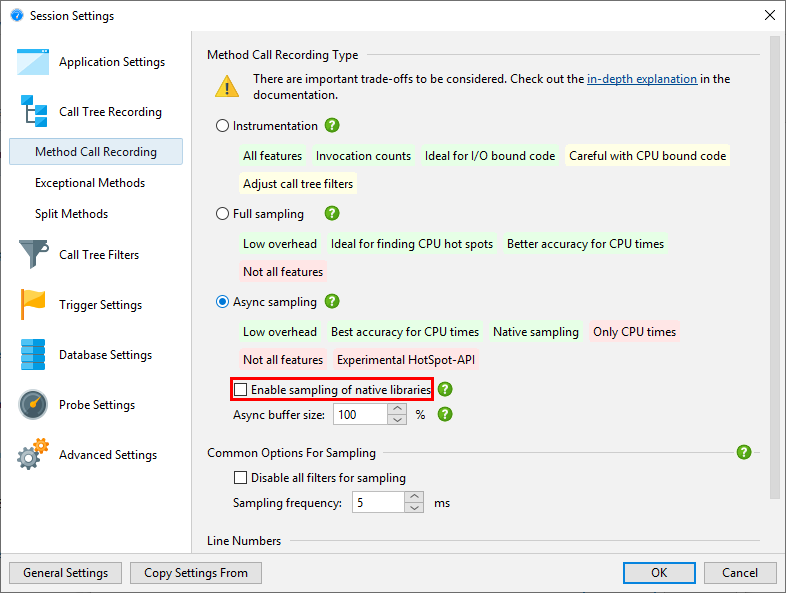
Because async sampling has access to the native stack, it can also perform native sampling. By default, native sampling is not enabled, because it introduces a lot of nodes into call trees and shifts the focus of hot spot calculation to native code. If you do have a performance problem in native code, you can choose async sampling and enable native sampling in the session settings.

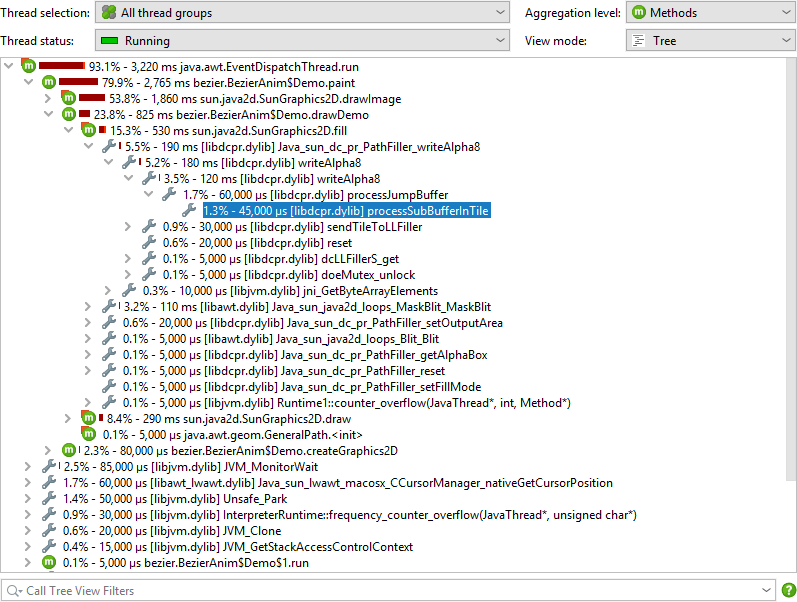
JProfiler resolves the path of the library that belongs to each native stack frame. On native method nodes in the call tree, JProfiler shows the file name of the native library in square brackets at the beginning.

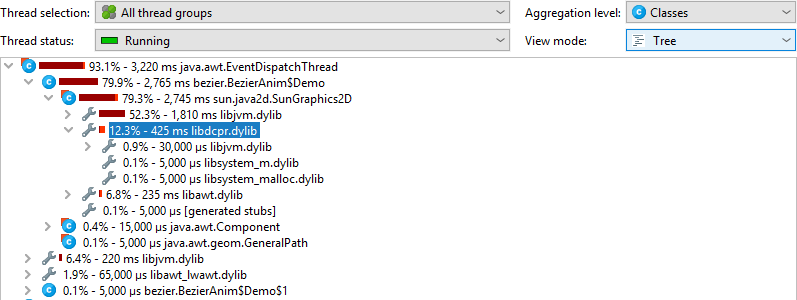
With respect to the aggregation level, native libraries act like classes, so in the "classes" aggregation level all subsequent calls within the same native library will be aggregated into a single node. The "packages" aggregation level aggregates all subsequent native method calls into a single node regardless of the native library.

To eliminate selected native libraries, you can remove a node from that native library and choose to remove the entire class.