Object counts in dynamic memory views and the heap walker
2009-04-22
Posted by Ingo Kegel
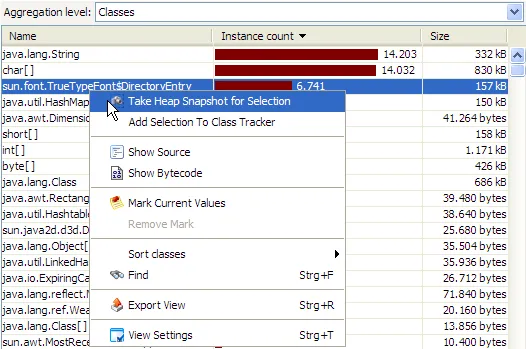
Here, for example, in the "All objects" view, a particular class has an object count of 6741:

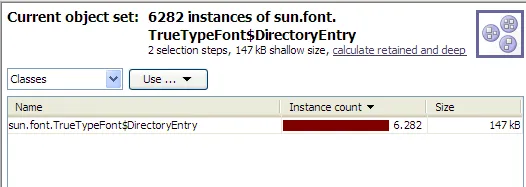
In the heap walker, the object count is only 6282:

The difference comes from objects that are not referenced anymore, but that are still on the heap because the garbage collector has not collected them yet. Clicking on the "Run GC" button in JProfiler might collect some, but not all of them, since the garbage collector does not do full collections in modern JVMs. However, when you take a heap snapshot, a full collection is done internally, so you only look at objects that you can actually do something about.
Ideally, we would exclude unreferenced objects from the dynamic memory views too, but this information requires an expensive calculation that can only be performed when taking a heap snapshot.
Archive
March/2
2025/20
Breaking the LLM Black Box: Custom Categorization in JProfilerProfiling AI: LangChain4j and Spring AI
February/1
October/1
August/1
July/2
2024/5
2023/7
The power of async tracking in JVM profilingWebsite refresh: Visual updates, dark mode, and semantic search for docs
June/4
All our artifacts are now published on Maven CentralJEP 493 follow-up: install4j 11.0.4 is ready for separate JMOD bundles in Eclipse Temurin 24.0.2JProfiler tips roundup May 2025JVM performance watch roundup May 2025
May/3
JProfiler tips roundup April 2025JVM performance watch roundup April 2025Heap Walker scripting for snapshot analysis
April/8
Capturing and comparing MBean states with JProfilerAdvanced SSH remote profiling with JProfilerProfiling Java applications in VS Code with JProfilerAdvanced Kafka probe configuration in JProfilerProfiling Kafka #1 – Message Flow & Hot SpotsBringing JProfiler to VS Code with Kotlin Multi-PlatformCaching auto-provisioned install4j distributions in CI pipelinesCross-platform JRE bundle creation under threat from JEP 493
January/1
September/5
2022/10
Garbage collector analysis in JProfilerRecording JFR snapshots with JProfilerEnhanced JFR snapshot analysis with JProfilerWorking with probe events in JProfilerCustomizing telemetries in JProfiler
March/1
January/1
December/2
November/3
2021/2
2020/1
2019/1
2018/3
2017/5
2016/1
2015/10
Using sunburst diagrams for understanding Java memory consumptionUsing flame graphs when profiling Java applicationsProfiling a Netty server
October/1
September/1
August/2
July/1
November/5
2014/3
2013/3
2012/5
2011/13
Analyzing specific parts of the call treeAnalyzing incoming and outgoing calls of a methodCollapsing recursions in the call treeRemote profiling through an SSH tunnelFinding JDBC connection leaks
June/5
December/1
October/2
September/5
2010/8
2009/14
Using the "Run interceptor script" trigger actionCreating a custom probeInspections in the heap walkerHeap walker graph: Finding paths between selected instancesFiltering in the reference view of the heap walker
August/4
Request trackingAnalyzing long-running AWT events with JProfilerProbes overviewCPU profiling: Sampling and instrumentation
February/1