Attaching to Windows services for Java profiling
2012-02-15
Posted by Ingo Kegel
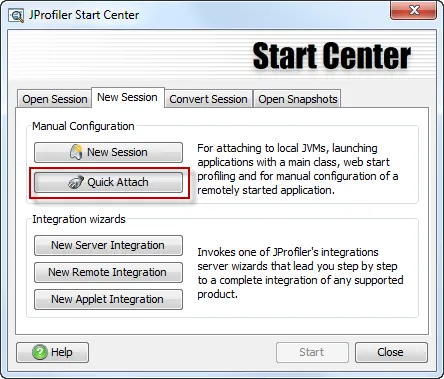
1.Start "Quick attach":
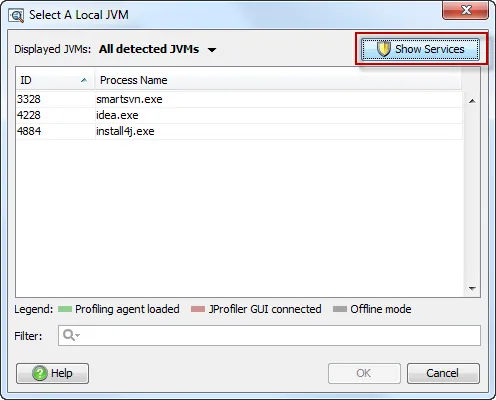
2. All JVMs are shown that run with your user account. Select the "Show services" button at the top:
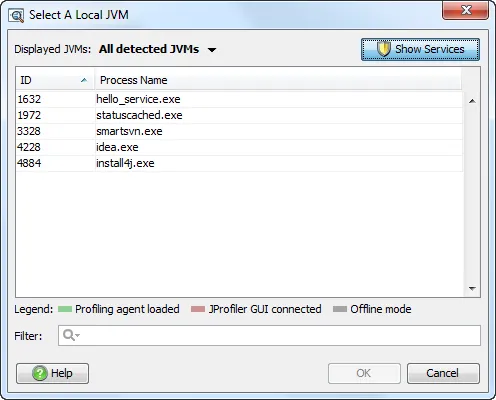
3. Select your service:
4. Profile!
Archive
March/2
2025/20
Breaking the LLM Black Box: Custom Categorization in JProfilerProfiling AI: LangChain4j and Spring AI
February/1
October/1
August/1
July/2
2024/5
2023/7
The power of async tracking in JVM profilingWebsite refresh: Visual updates, dark mode, and semantic search for docs
June/4
All our artifacts are now published on Maven CentralJEP 493 follow-up: install4j 11.0.4 is ready for separate JMOD bundles in Eclipse Temurin 24.0.2JProfiler tips roundup May 2025JVM performance watch roundup May 2025
May/3
JProfiler tips roundup April 2025JVM performance watch roundup April 2025Heap Walker scripting for snapshot analysis
April/8
Capturing and comparing MBean states with JProfilerAdvanced SSH remote profiling with JProfilerProfiling Java applications in VS Code with JProfilerAdvanced Kafka probe configuration in JProfilerProfiling Kafka #1 – Message Flow & Hot SpotsBringing JProfiler to VS Code with Kotlin Multi-PlatformCaching auto-provisioned install4j distributions in CI pipelinesCross-platform JRE bundle creation under threat from JEP 493
January/1
September/5
2022/10
Garbage collector analysis in JProfilerRecording JFR snapshots with JProfilerEnhanced JFR snapshot analysis with JProfilerWorking with probe events in JProfilerCustomizing telemetries in JProfiler
March/1
January/1
December/2
November/3
2021/2
2020/1
2019/1
2018/3
2017/5
2016/1
2015/10
Using sunburst diagrams for understanding Java memory consumptionUsing flame graphs when profiling Java applicationsProfiling a Netty server
October/1
September/1
August/2
July/1
November/5
2014/3
2013/3
2012/5
2011/13
Analyzing specific parts of the call treeAnalyzing incoming and outgoing calls of a methodCollapsing recursions in the call treeRemote profiling through an SSH tunnelFinding JDBC connection leaks
June/5
December/1
October/2
September/5
2010/8
2009/14
Using the "Run interceptor script" trigger actionCreating a custom probeInspections in the heap walkerHeap walker graph: Finding paths between selected instancesFiltering in the reference view of the heap walker
August/4
Request trackingAnalyzing long-running AWT events with JProfilerProbes overviewCPU profiling: Sampling and instrumentation
February/1