Why JVMTI sampling is better than async sampling on modern JVMs
In recent years, "async sampling" has been hyped as a better way of CPU profiling on the JVM. While this has been true for some time, it is no longer the case. This blog post explains the history of sampling and the current state of the art.
The problem
The fundamental operation of a CPU profiler is to associate time measurements with call stacks. To obtain call stacks from all live threads, most CPU profilers perform sampling. Sampling means that data is measured periodically rather than continuously. However, this measurement is not trivial because the JVM does not store call stack information for easy access via an API.
The JVM compiles Java bytecode to native code for hot execution paths. The stack traces now have a native part that needs to be retranslated to Java in order to be useful. Also, it is not possible to ask a running thread what it's currently doing, but you have to interrupt it to get a defined state. Depending on how you do it, this introduces an observer effect that can severely alter the execution of the program.
Historically, sampling could only be done at a global safepoint. Global safepoints are states where the JVM can pause all threads for operations that require a consistent view of memory. At a safepoint, all Java threads are paused, ensuring they are not in the middle of modifying shared data. While safepoints originated from the stop-the-world phase of garbage collectors, they could also be used for other purposes, such as code deoptimization, class redefinition, and finally to safely get all stack traces for the purposes of sampling.
In contrast to garbage collector activity, sampling is performed quite frequently, on the order of once per millisecond. Requesting a global safepoint so many times per second can cause substantial overhead and a severe distortion of the observed hot spots. The adverse effects of global safepoints are especially pronounced for heavily multithreaded applications, where safepoints can limit concurrency, reduce thread cooperation and increase contention and synchronization overhead. The observed hot spots will then be skewed towards the safepoints, an effect known as safepoint bias.
Async profiling to the rescue
Unhappy with this state of affairs, the HotSpot JVM developers added the experimental AsyncGetStackTrace
API that allowed profilers to get the stack trace of threads without requiring a safepoint. On Unix systems, profilers
can use various signal mechanisms to periodically interrupt the running thread and execute a handler on the interrupted
thread and call this API.
While this adds minimal overhead, it unfortunately is not an ideal solution. The main problem is that the interrupted thread and the JVM in general are in an unsafe state. The handler must be very careful not to perform any operation which might crash the process. These restrictions, especially regarding memory access and allocations make some advanced features of a profiler unfeasible. Also, the retranslation of the stack traces back to the Java stack trace results in a lot of stack traces being truncated or otherwise invalid. In addition, async sampling is also sampling from the pool of all live threads, so rarely scheduled threads will sometimes be missed completely.
JProfiler supports JVMTI sampling as well as async sampling, and as part of our tests we perform a lot of data comparisons. While async sampling is near-zero overhead and eliminates safepoint bias, it introduces a certain "trashiness" to the data and places limits on which features are possible to implement. For a long time, it seemed like an unavoidable trade-off with only bad options. One could choose one or the other sampling method based on the type of application and accept the corresponding drawbacks.
ZGC and thread-local handshakes
In the quest for an ultra-low latency garbage collector, the JVM developers needed a way to perform operations on individual threads without requiring a global VM safepoint. In Java 10, JEP 312 was delivered with no concrete use cases. While intriguing at the time, we were unable to make any use of this feature because it was internal to the JVM and not available for profiling agents.
The only publicly mentioned purpose in JEP 312 was that it blocked JEP 333 for the Z Garbage Collector (ZGC). In Java 11, ZGC was delivered as one of the big-ticket items, and thread-local handshakes helped it push maximum GC pause times below 10ms.
ZGC continued to be improved, and JEP 376 aimed to evict its last major work item from global safepoints: The processing of thread-related GC roots was moved to a concurrent phase. That JEP included a goal to "provide a mechanism by which other HotSpot subsystems can lazily process stacks" and issues like https://bugs.openjdk.org/browse/JDK-8248362 added this capability to the JVMTI, the interface that is used by native profiling agents.
JVMTI sampling strikes back
With Java 16, JEP 376 was delivered, and it was possible for profiling agents to use the lazy stack processing based on thread-local handshakes and avoid global safepoints for sampling. JVMTI sampling (called "full sampling" in JProfiler), is now comparable in overhead with async sampling and, given the frequency of local safepoints, the remaining local safepoint bias is irrelevant for the vast majority of applications.
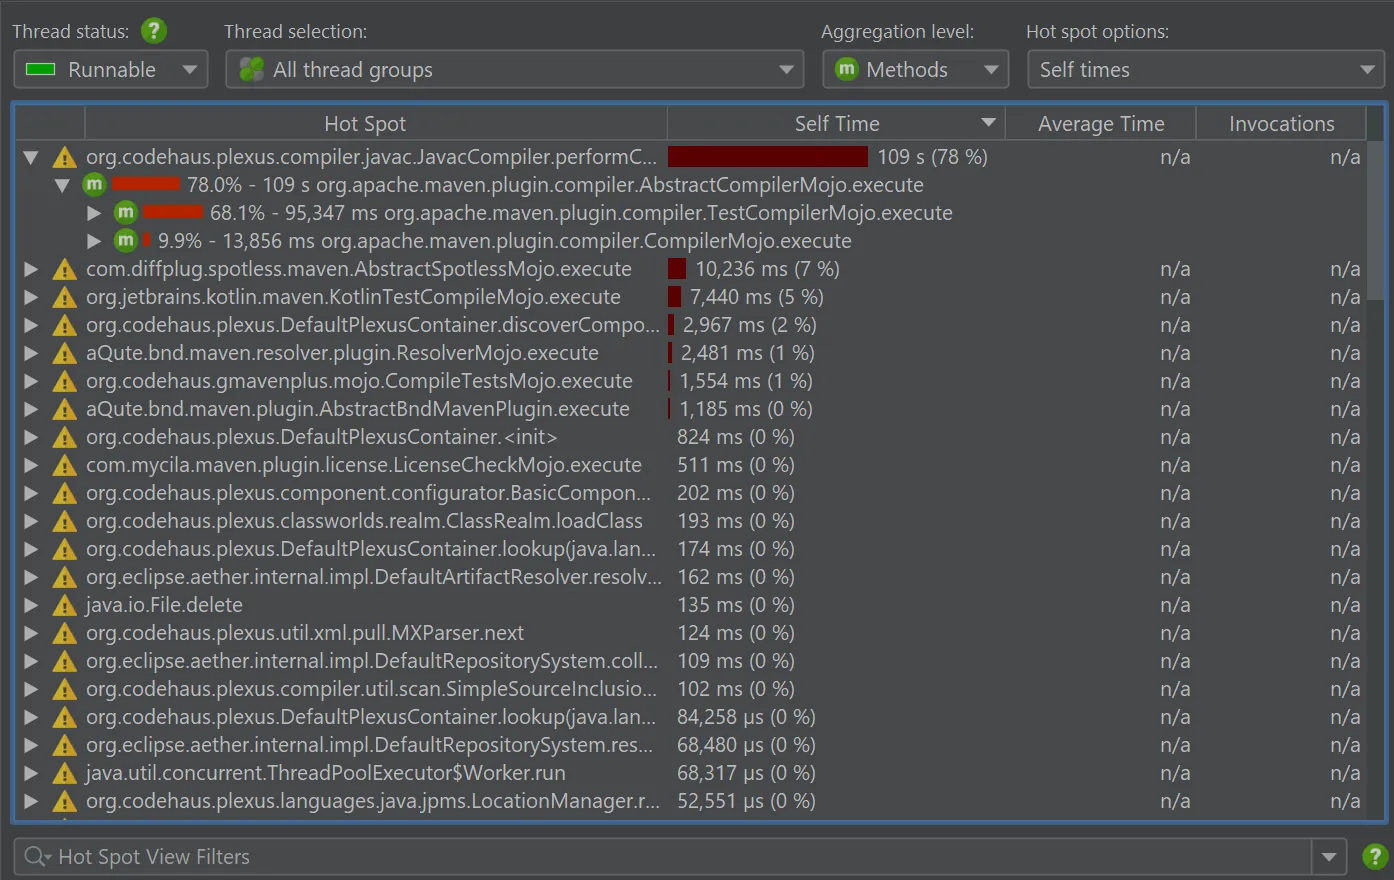
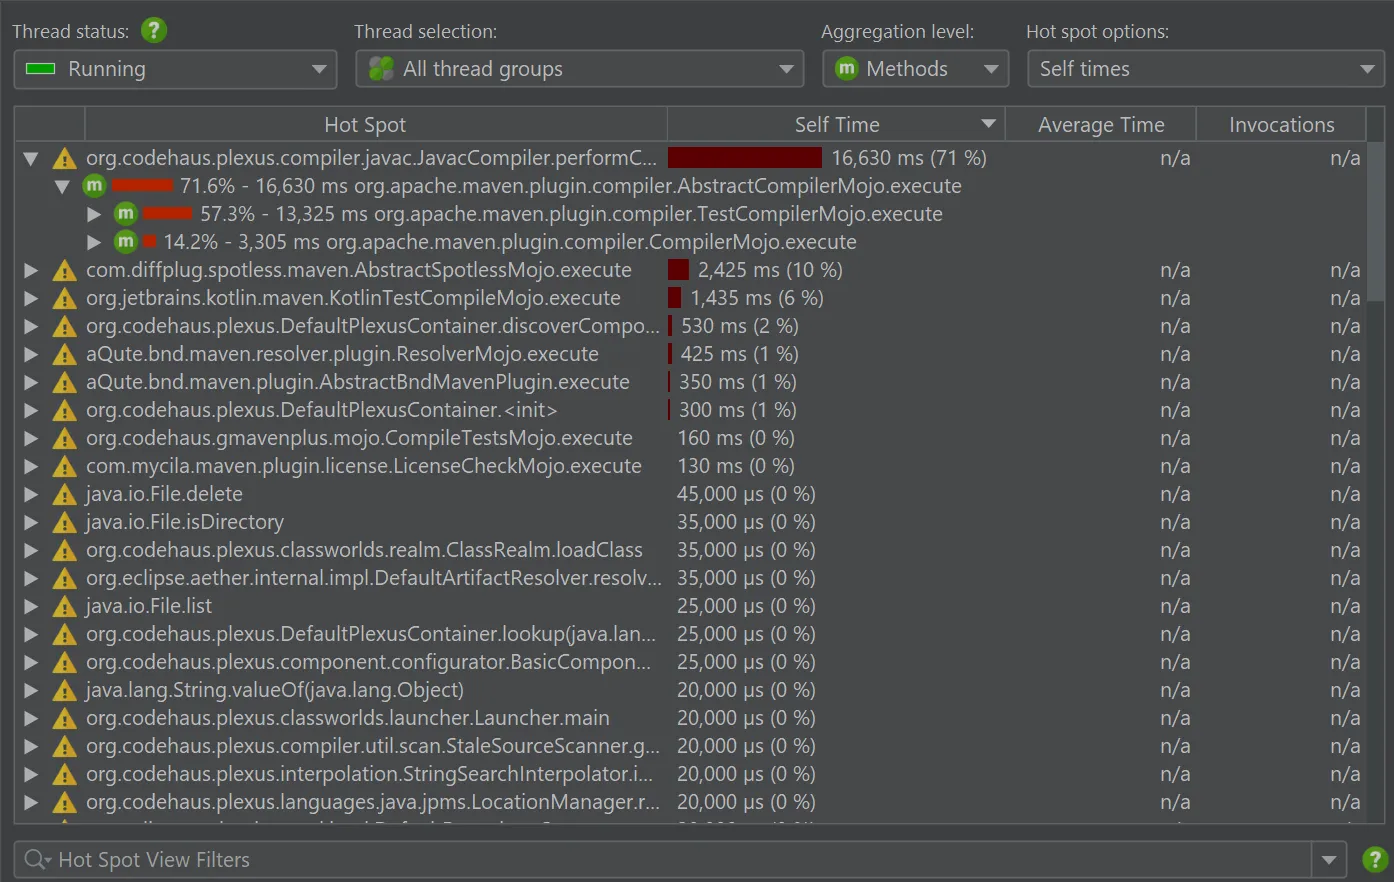
Let's compare a real-world use case. A multithreaded Maven compilation for a medium-sized project was recorded with both JVMTI sampling and async sampling. The overhead is not measurably different, and the hot spot distribution is very similar. See the "Hot spots" view in JProfiler below, first for JVMTI sampling:

… and then for async sampling:

Is the difference the remaining safepoint bias? Not necessarily so, and most probably not. There are two other important factors at play: First, async sampling measures threads that are actually running while JVMTI sampling measures if threads are scheduled for execution, that is if they are "runnable". The JProfiler UI reflects this in the labelling of the thread status.
Second, async sampling operations do not work all the time. The technical "outages" are summed up at the bottom of the call tree without contributing to the total percentage:

These are substantial times and they do contribute some skew. So while async sampling measures actual CPU times, they are only partial CPU times and not a more useful measure than the runnable time measured by JVMTI sampling.
As an example of a feature that async sampling cannot provide, try to change the thread state to "Waiting", "Blocking" or "Net I/O". With async sampling, these are not available, unlike with JVMTI sampling.

When working with databases or REST services, having access to the "Net I/O" state is an invaluable benefit, though, because these are the times waiting for the external service.
What remains for async sampling? Async sampling can profile native stack traces, so if you are interested in that, it remains a useful tool. Other than that, full sampling is now by far the better alternative, in terms of data quality and available features, without compromising on overhead.
We invite you to try it out in the latest JProfiler release. Happy profiling!