Refreshed JProfiler IDEA plugin for the new UI
Kotlin 2.0 features a total rewrite of the Kotlin compiler known as "Kotlin K2". IntelliJ IDEA will remove support for the old compiler in version 2024.3 impacting all plugins that depend on the Kotlin plugin, such as the JProfiler IDEA plugin.
The newest version of the JProfiler IDEA plugin for IntelliJ IDEA now includes support for Kotlin K2 mode. This means that the JProfiler plugin no longer prevents switching to K2 mode in IntelliJ IDEA 2024.2 and is now ready for IntelliJ IDEA 2024.3 where K2 mode will be the default and plugins depending on the old API will no longer be loaded.
We took this opportunity to align the JProfiler plugin with another recent major change in IntelliJ IDEA: The new UI, which became the default in IntelliJ IDEA 2024.2. It is impractical for IDEA plugins to support both the old and the new UI, so we decided to change the UI once the new UI became widely used.
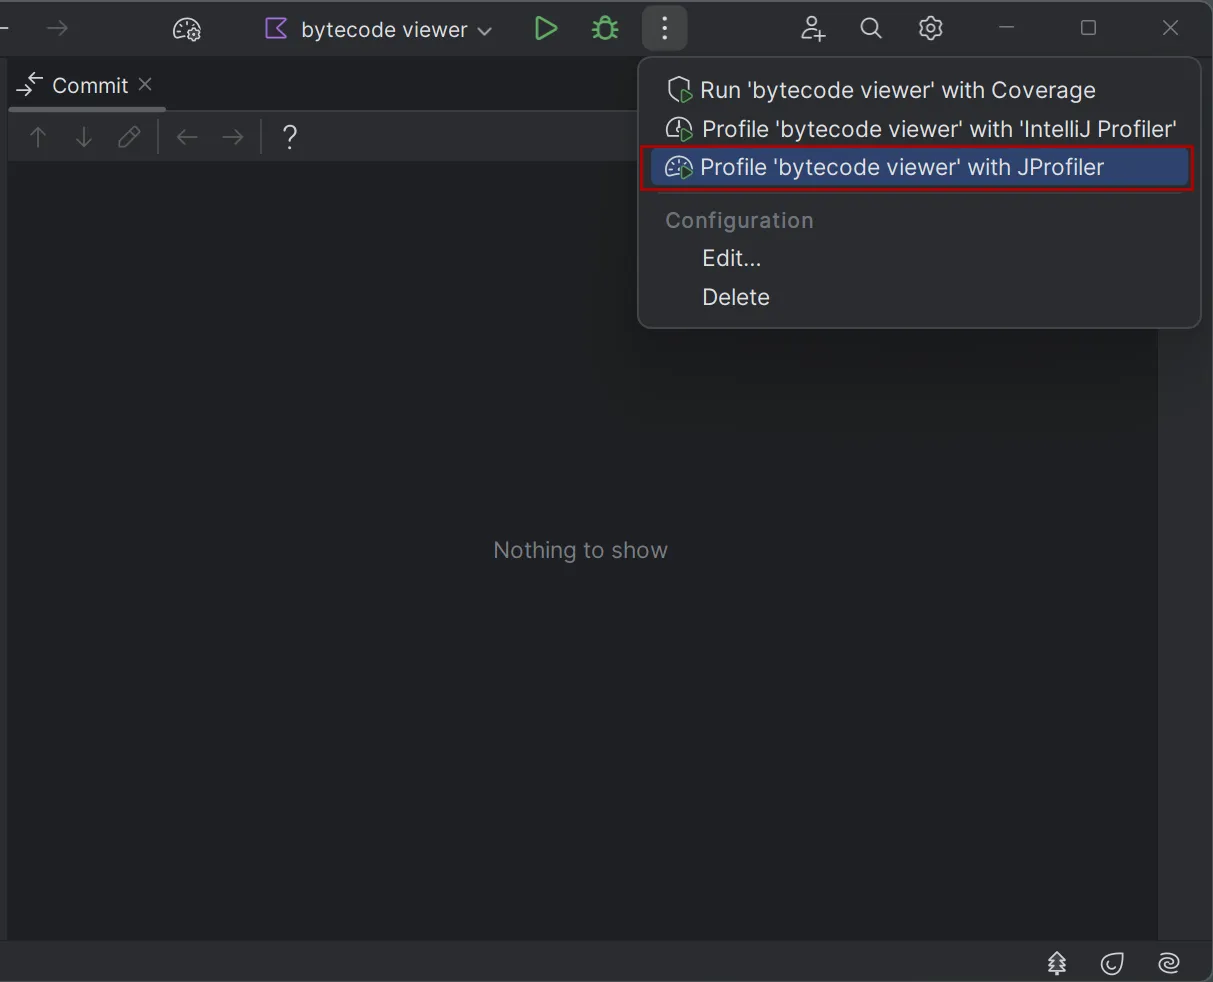
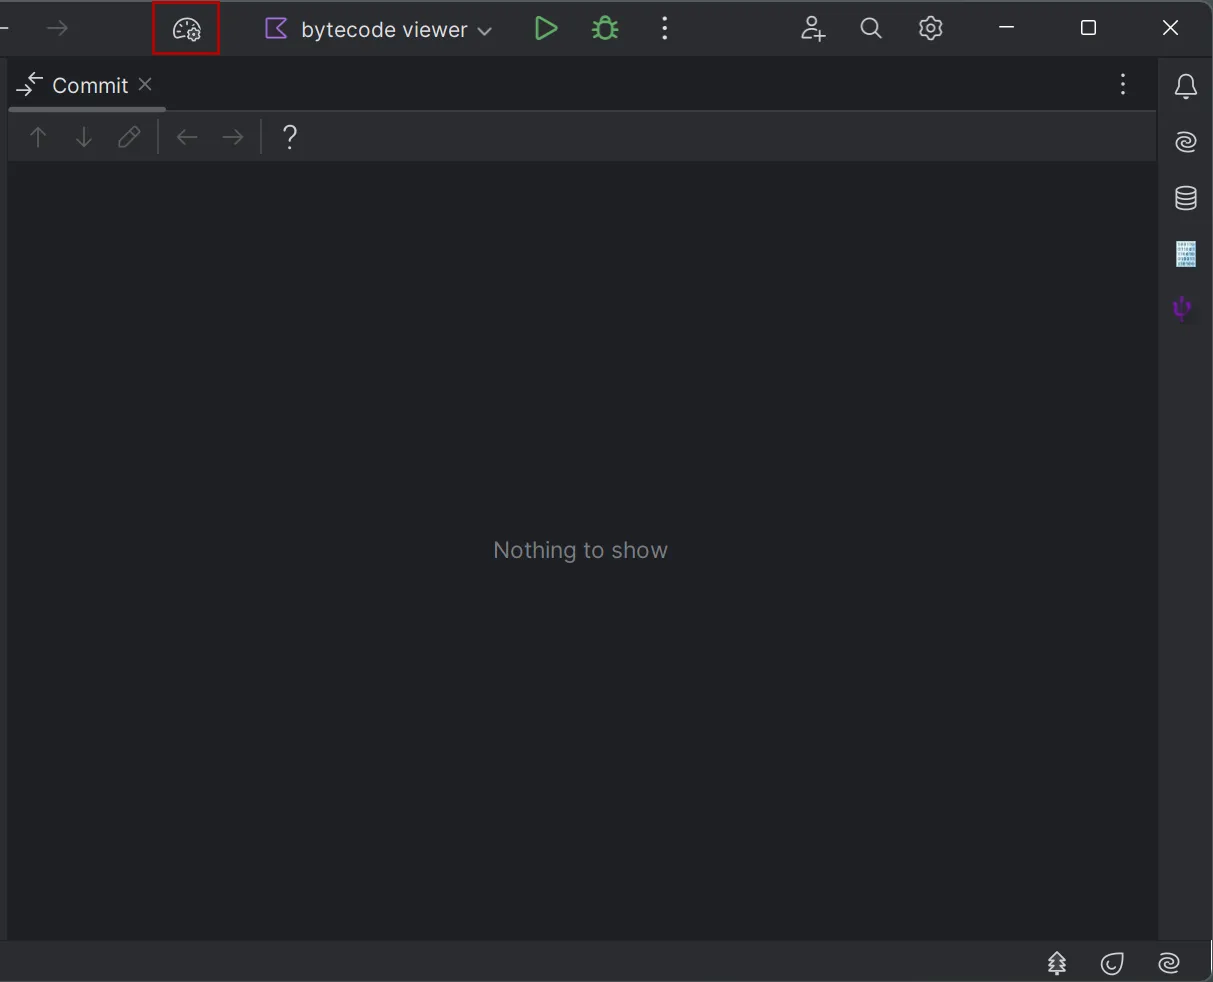
Plugin icons have been adjusted to the style of the new UI in IDEA. The action to profile the selected run configuration with JProfiler continues to be available in the dropdown menu of the run widget:
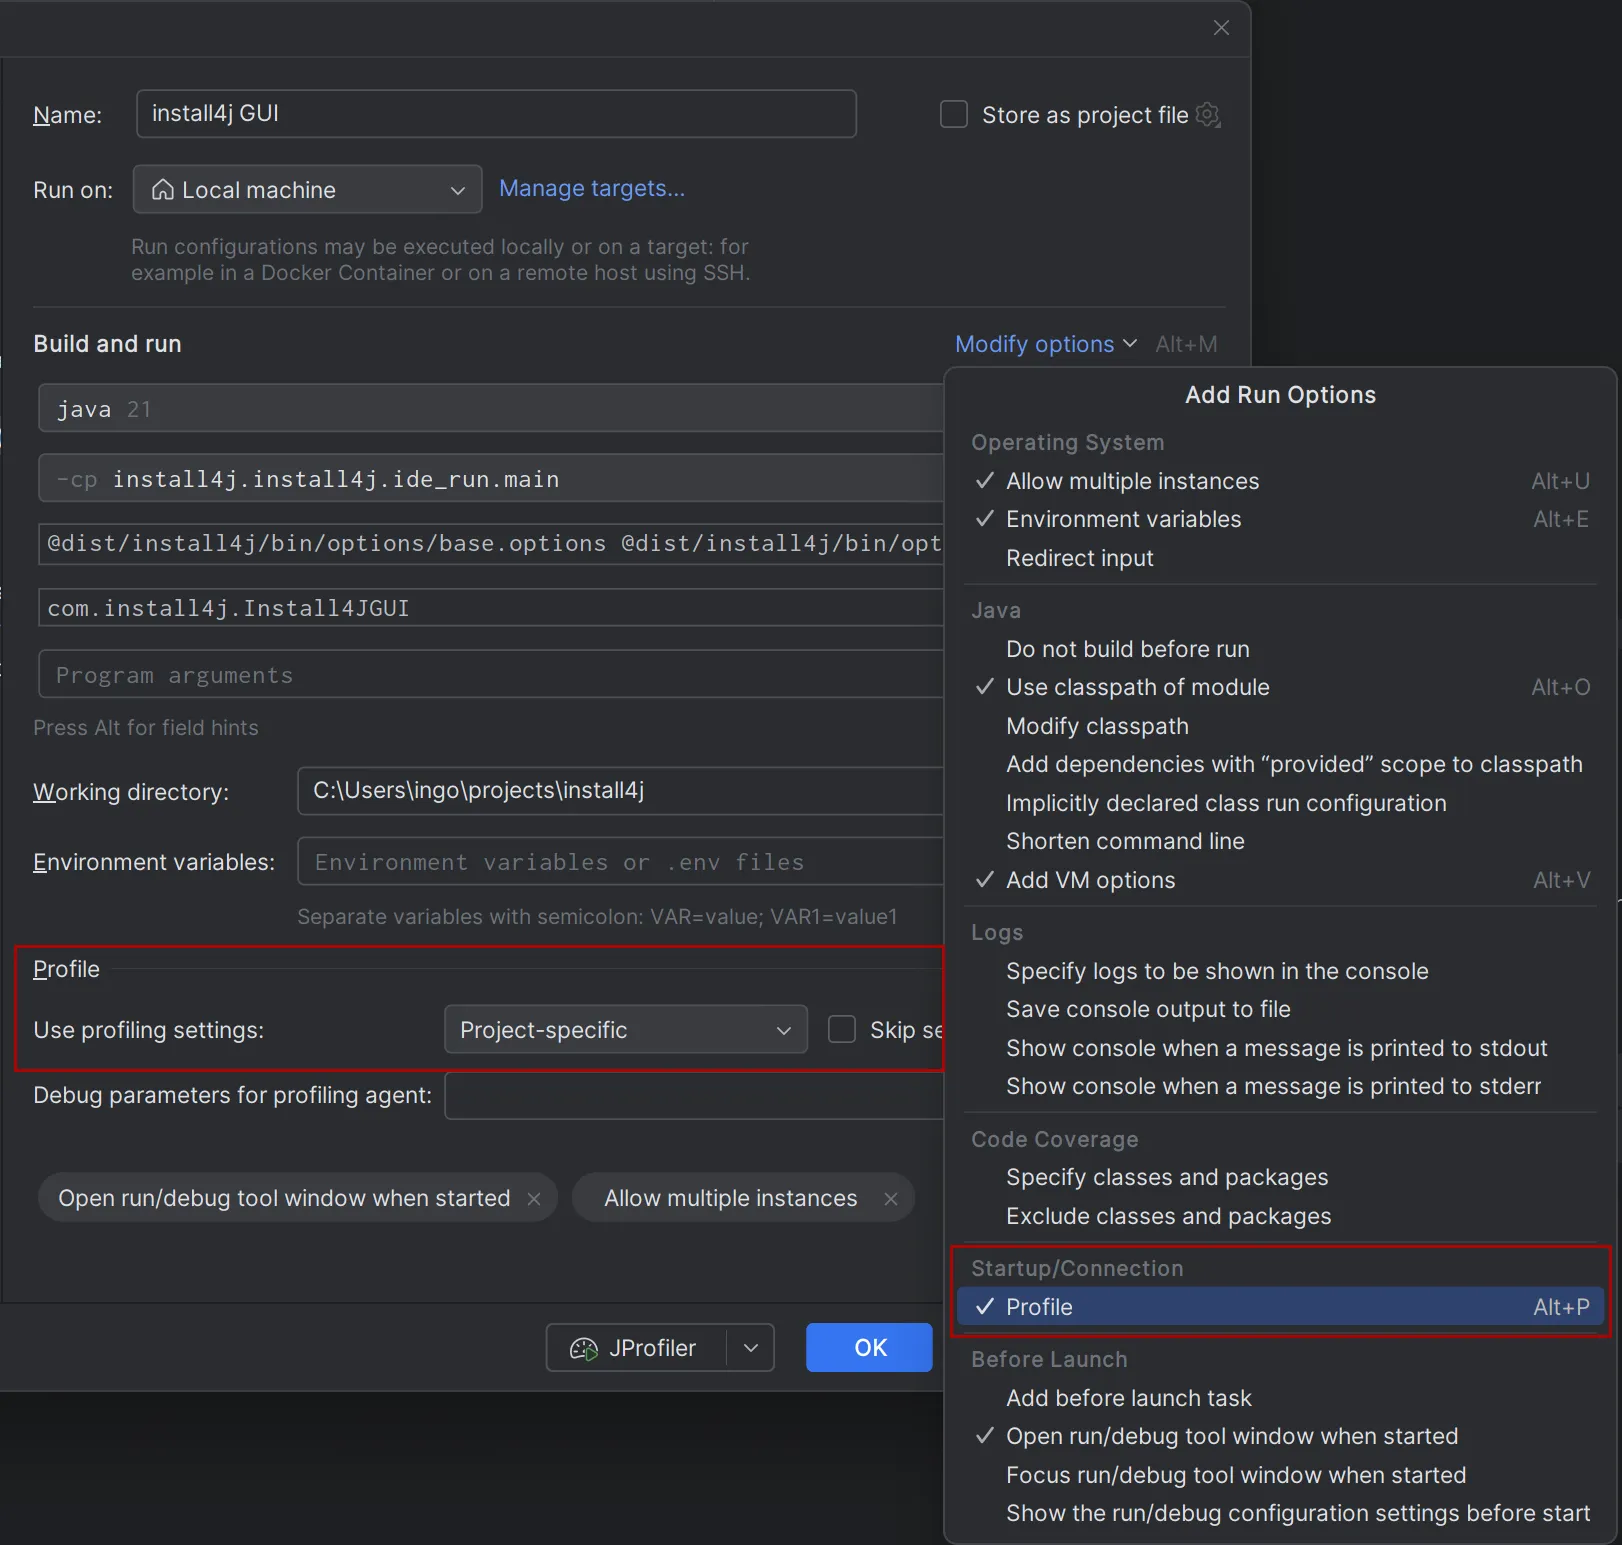
The JProfiler plugin adds additional settings to run configurations which are not immediately visible. To access these settings, select the "Profile" option in the "Modify options" dropdown. All other profiling settings can be configured in the startup dialog of the JProfiler window.
Once the profiling session is started, the output appears in a separate JProfiler tool window. That tool window displays the console output like the regular run tool window, along with a "JProfiler" tab that can be used after you connect with the JProfiler UI:
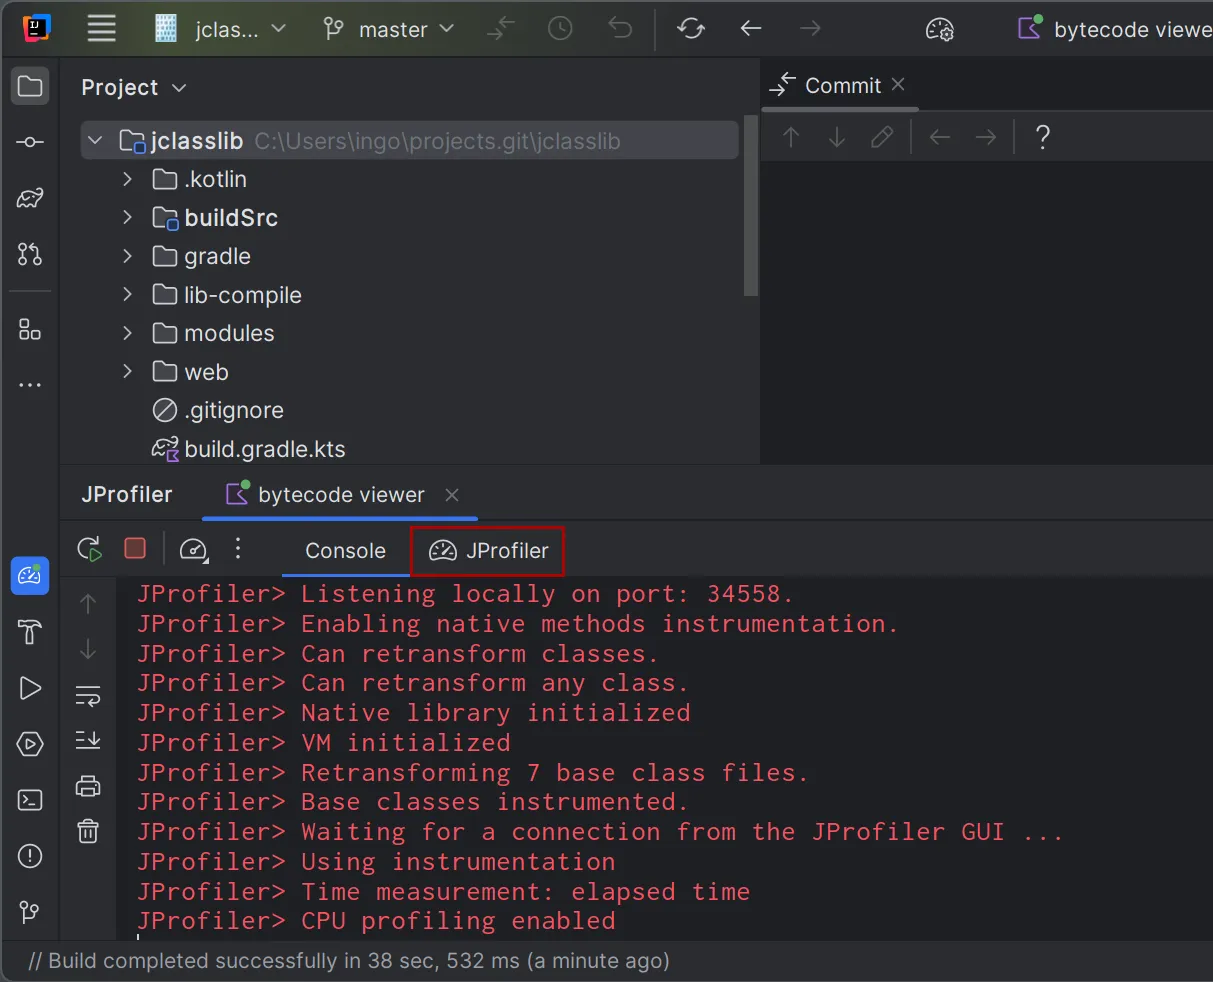
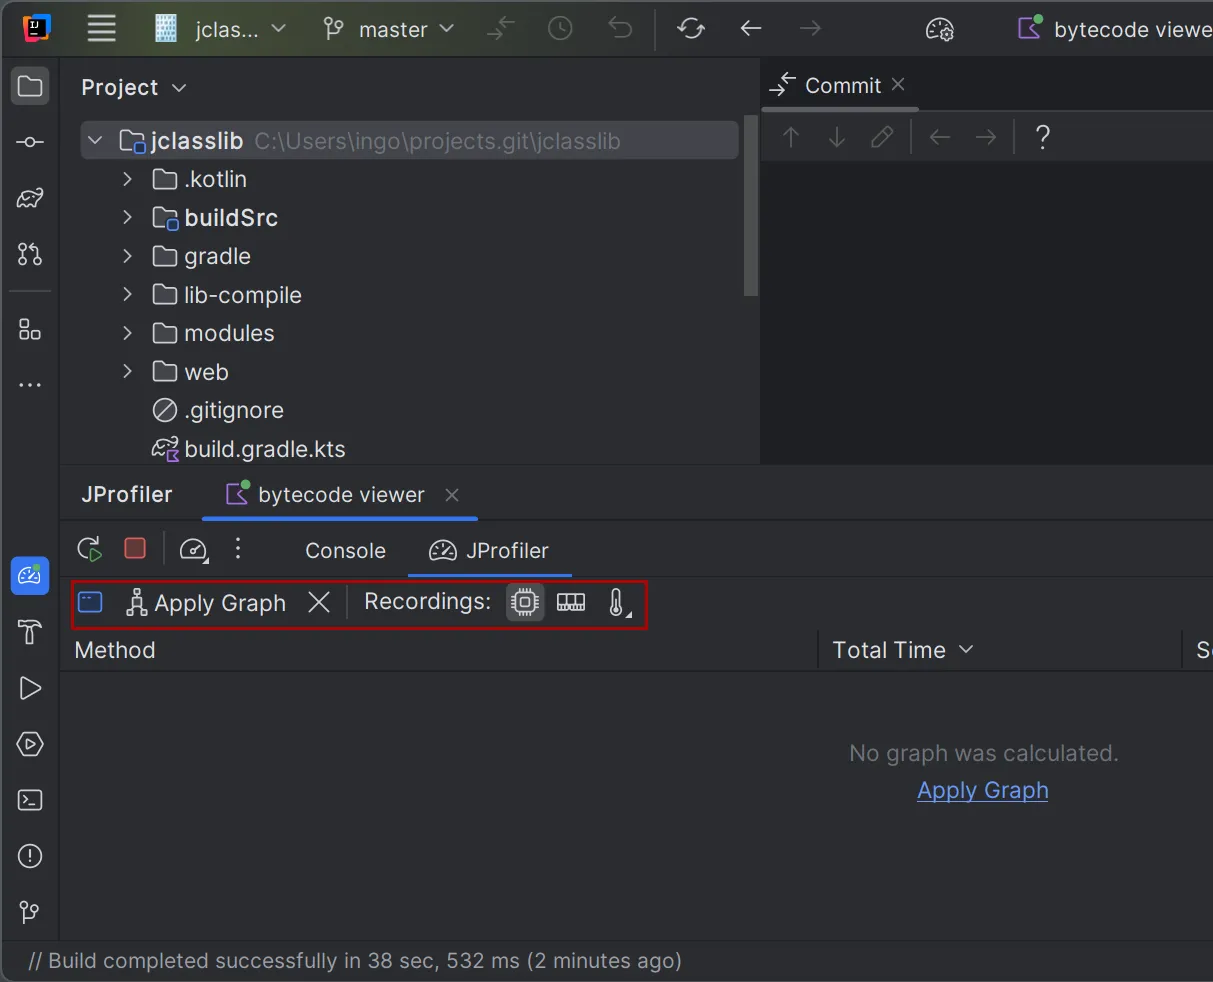
The "JProfiler" tab contains actions to start and stop data recording for CPU data, allocation data and probe events. Additionally, an action allows you to switch to the JProfiler window. The JProfiler window includes a similar action for switching back to the IDEA window, so that it becomes convenient to work with the two separate windows.
Profiling information is typically displayed in the JProfiler window, but the CPU graph data is also integrated in the IntelliJ IDEA UI because it makes sense to show this data directly in the source code. Use the "Apply graph" action in IntelliJ IDEA or generate a CPU graph in JProfiler to display CPU data within IntelliJ IDEA.
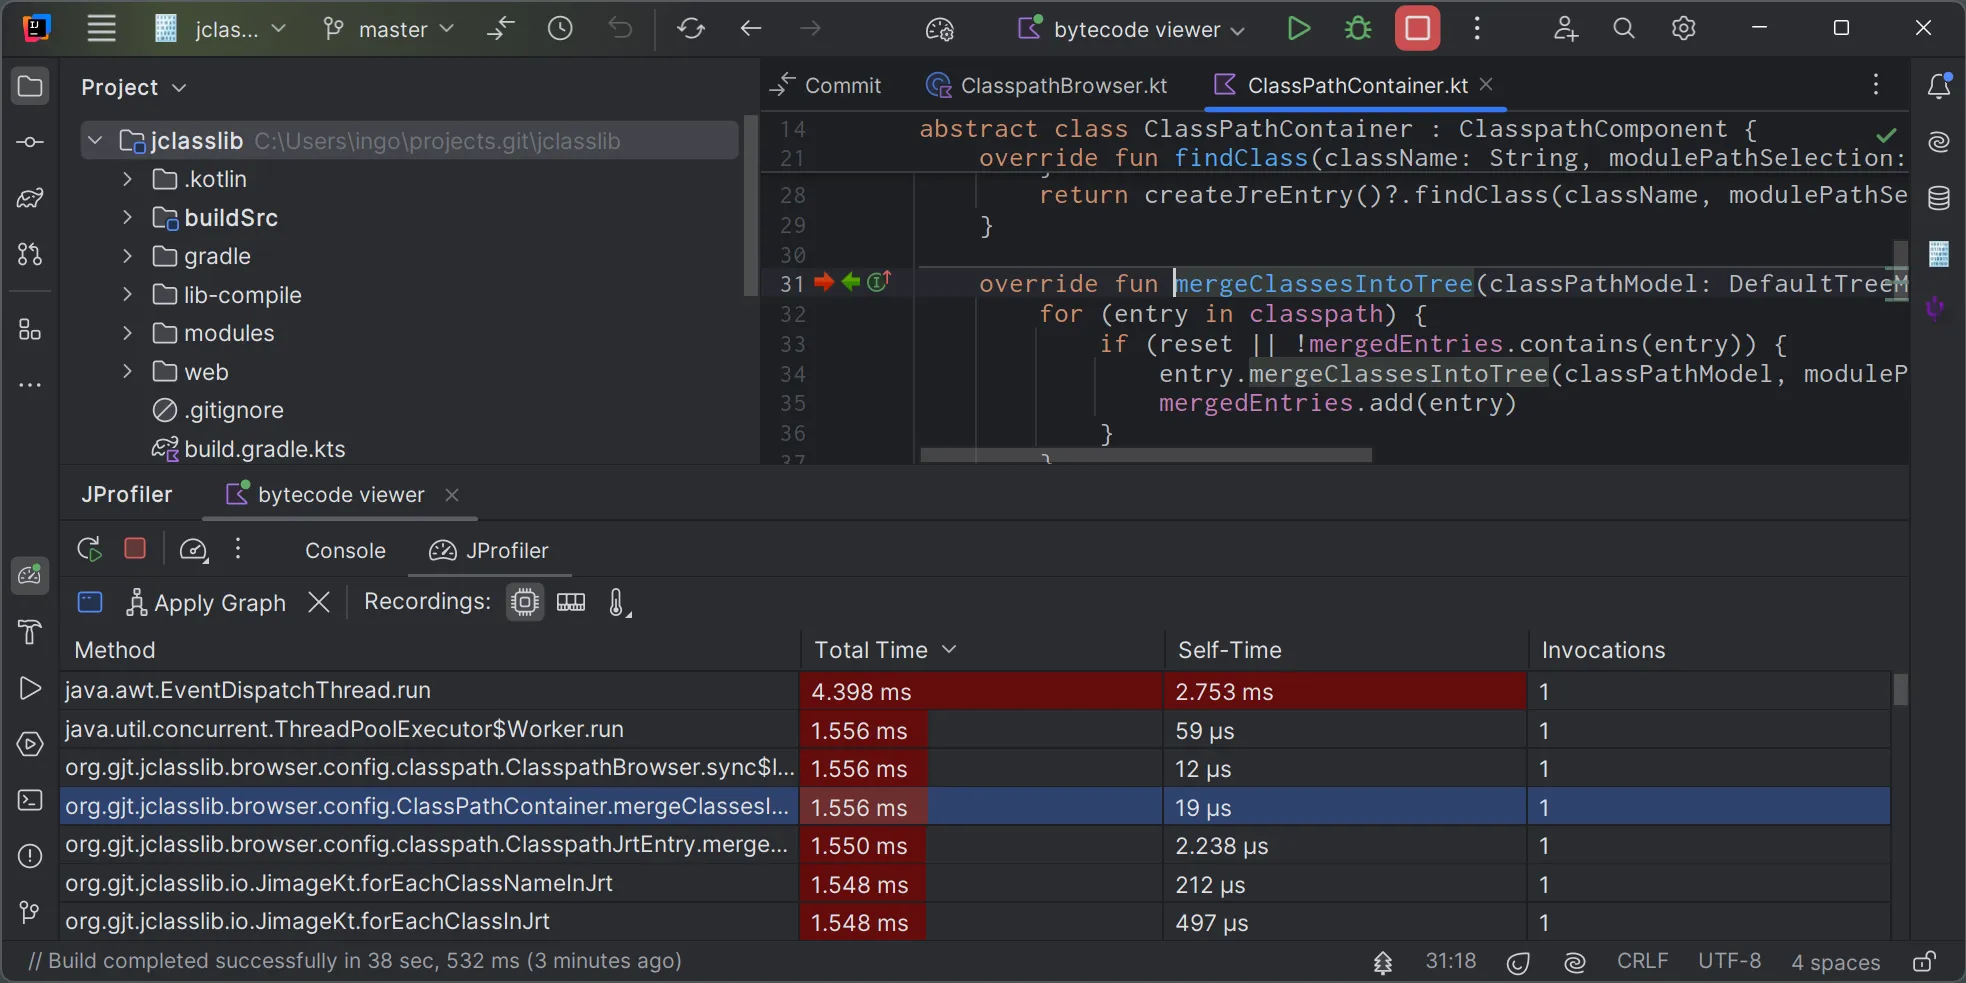
Once the CPU data has been applied, the "JProfiler" tab displays a list of recorded methods. Double-clicking on a method will take you to the source code. In the gutter of the source code editor, arrows for incoming and outgoing calls are added.
Clicking on a gutter icon displays the incoming or outgoing methods in a popup window, along with a bar chart showing the recorded times. Clicking on rows in the popup will navigate to the corresponding methods.
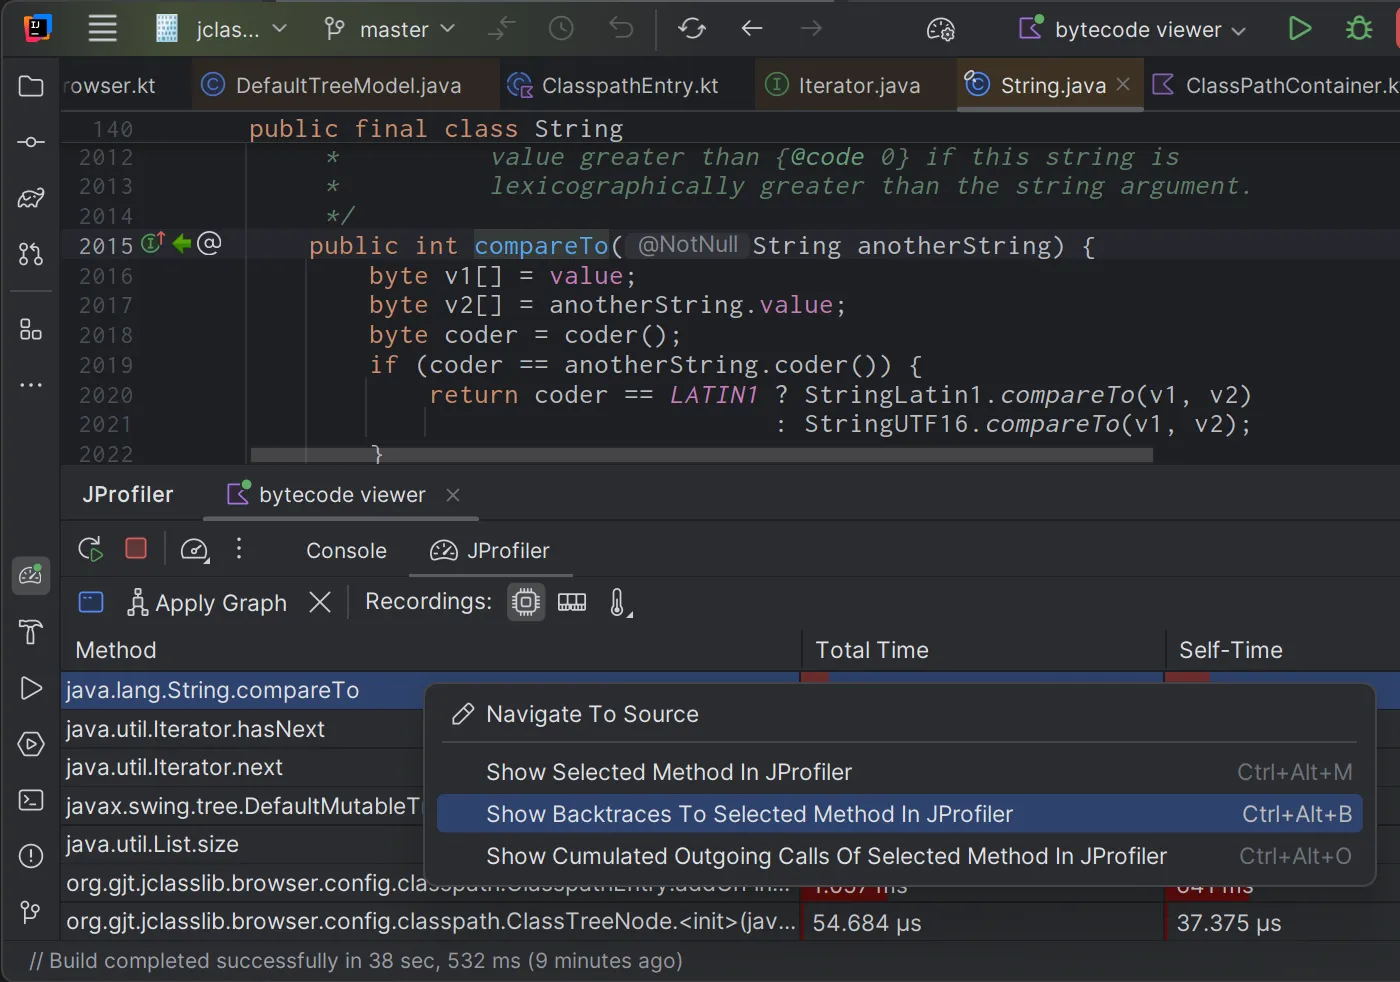
Also, the total recorded time and the invocation count for the target method will be shown at the bottom of the popup. The "Show in JProfiler" drop down in the bottom-right corner of the popup provides context-dependent navigation actions into the JProfiler UI.
The same navigation actions are also available in the context menu of the method table in the "JProfiler" tab:
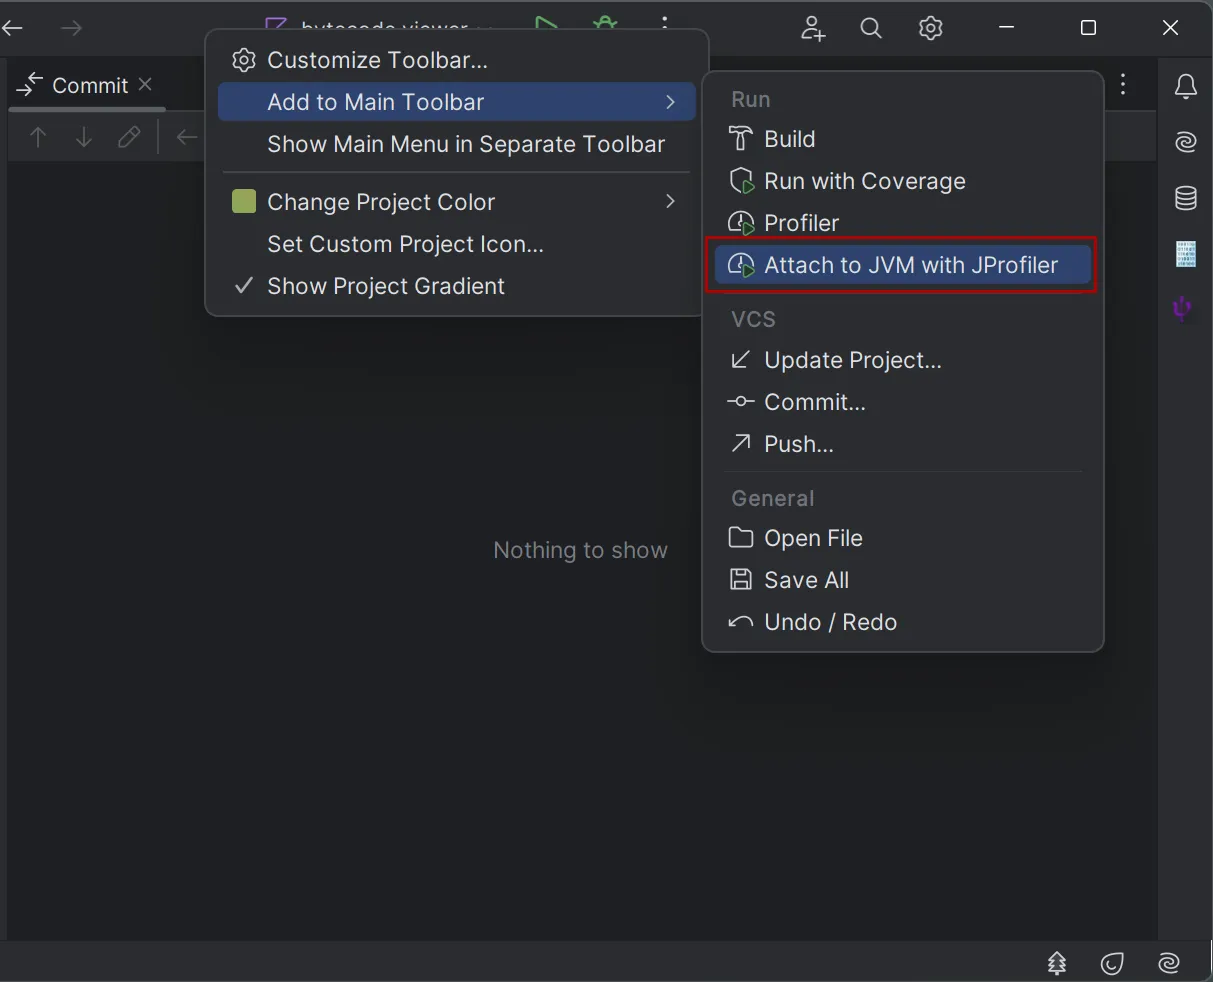
One major change in the new IntelliJ IDEA UI is that plugins no longer add actions to the main toolbar. Instead, plugins can provide "toolbar quick actions" that are shown when you choose the "Add to Main Toolbar" action in the context menu of the main toolbar.
In the new JProfiler plugin there is now a toolbar quick action for the "Attach to JVM with JProfiler" action. With that action you can attach to a process that is already running and still get source code navigation from the JProfiler UI into IntelliJ IDEA as well as inline CPU graph data in source code editors:
This is how the action button looks like once it has been added:
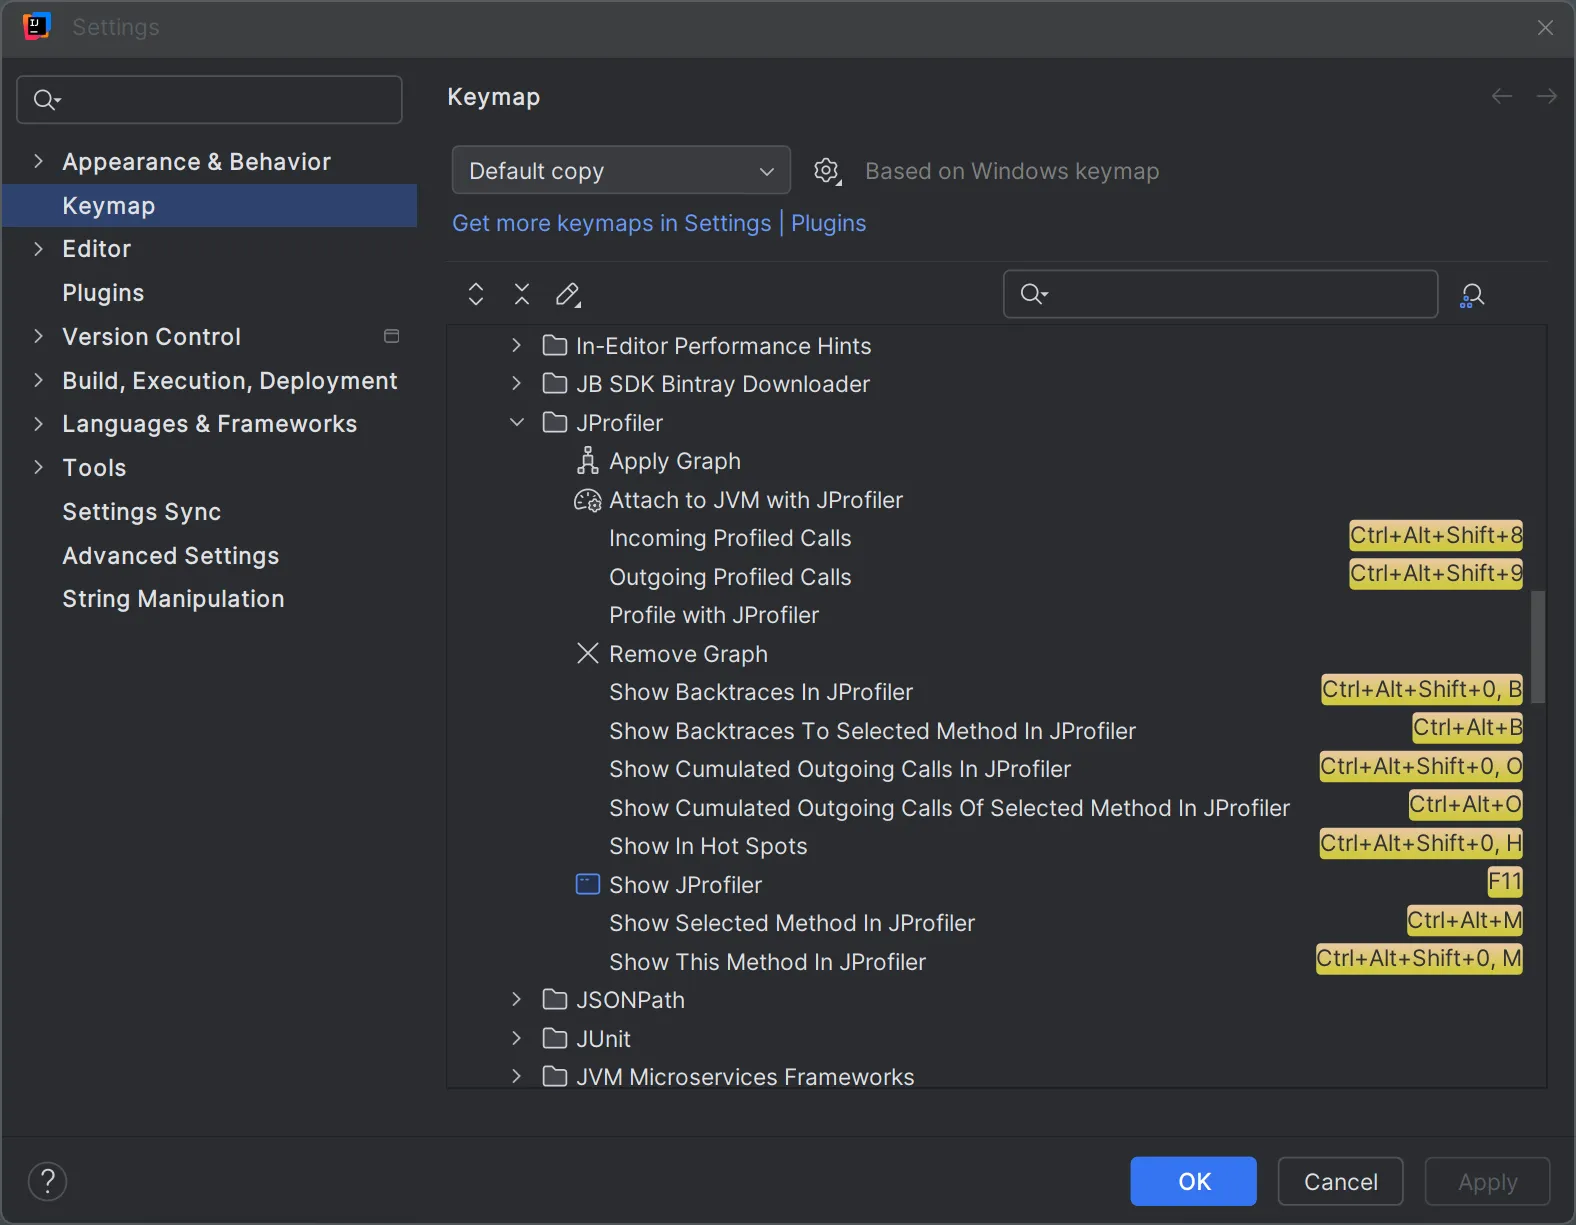
The key bindings for all actions in JProfiler can be customized in the "Keymap" settings in IntelliJ IDEA. Given the limited availability of non-conflicting keyboard shortcuts, the navigation actions from the source code editor to the JProfiler UI are chained shortcuts where you first hit Ctrl-Alt-Shift-O and then another key to select the navigation action. If you frequently use this functionality, you may want to assign simpler keyboard shortcuts.