Flame graphs have been added. All views that show call trees can alternatively be shown as flame graphs that show the entire content of a call tree in one image. Calls originate at the bottom of the flame graph and propagate towards the top.
What's new in JProfiler 12.0
Change release:
Please see the change log for a detailed list of changes.
JProfiler 12.0 introduces the following notable new features:
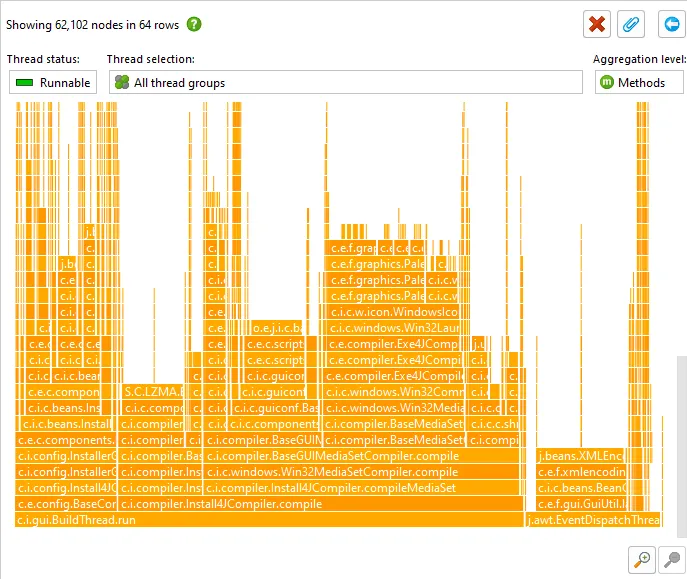
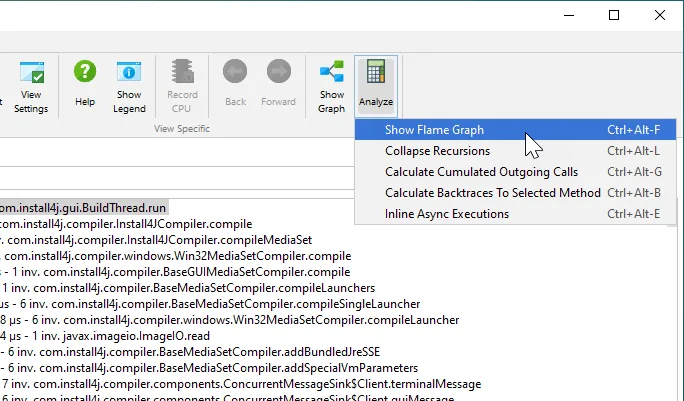
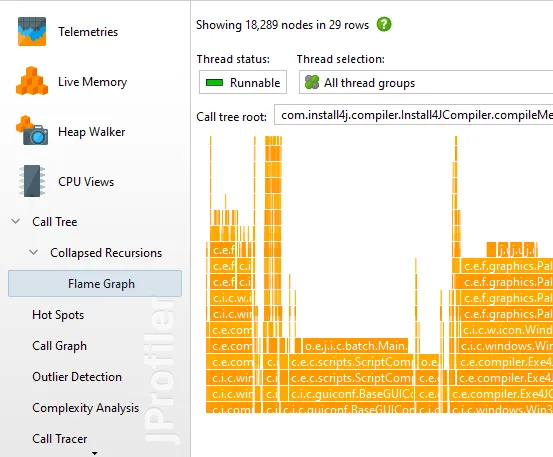
Flame graphs are implemented as a call tree analysis and are nested below the current call tree view. By selecting a node in the call tree, you can set the initial root node for the flame graph.
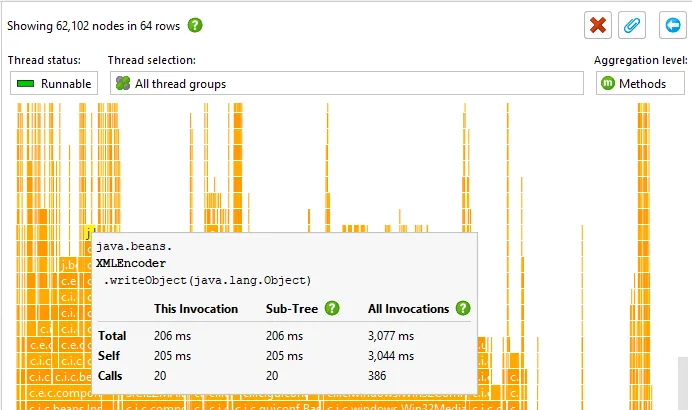
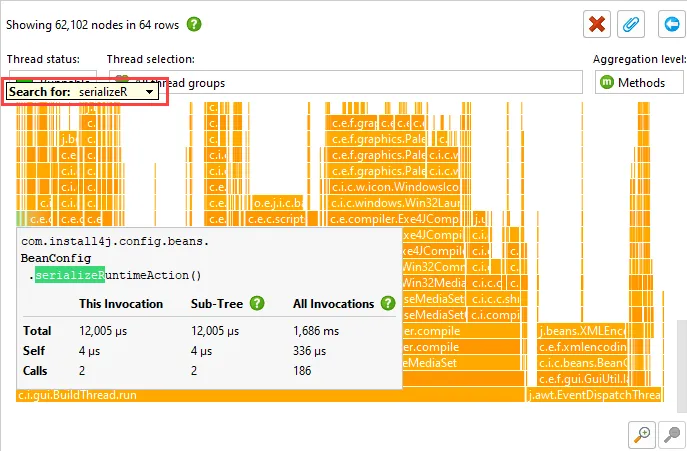
Child nodes are sorted alphabetically and are centered on their parent node. Due to the self-time that is spent in each node, the "flames" get progressively more narrow toward the top. More information about nodes is displayed in the tool tip.
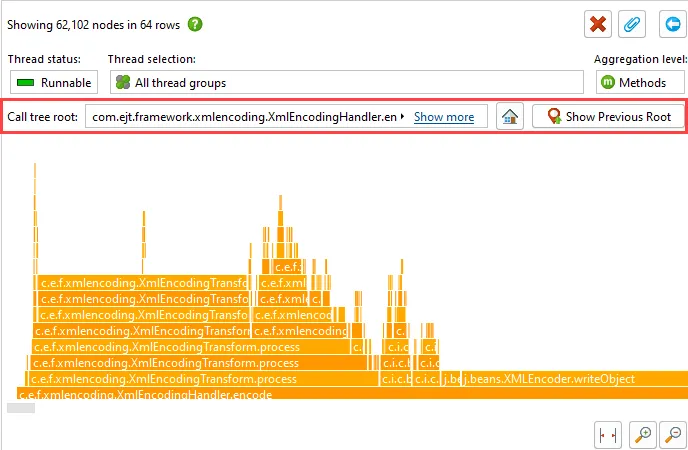
Flame graphs have a very high information density. You can zoom in on areas of interest, or set a new root node by double-clicking on it. When changing roots multiple times in a row, you can move back again in the history of roots.
Another way to analyze flame graphs is to add colorizations based on class names, package names or arbitrary search terms. The first matching colorization is used for each node.
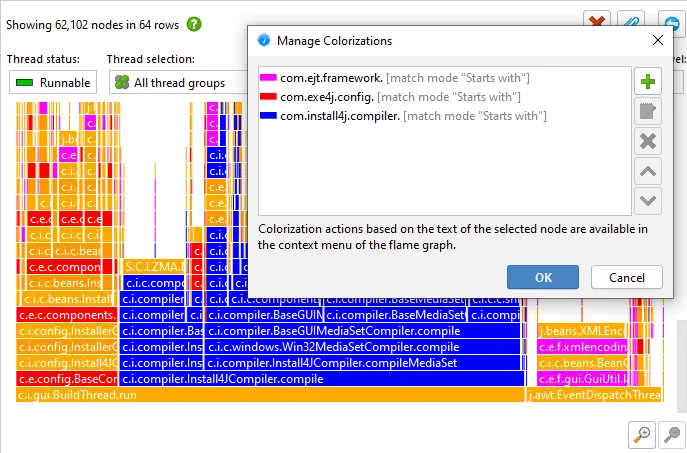
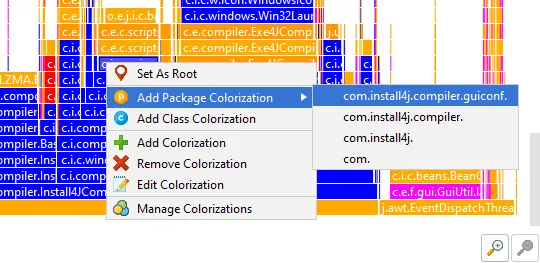
Colorizations can be conveniently added and removed from the context menu.
In addition to colorizations, you can use the quick search functionality to find nodes of interest. With the cursor keys you can cycle through match results while the tooltip is being displayed for the currently highlighted match.
Flame graphs are not only available for top-level call tree views but also for the results of other call tree analyses, such as "Collapsed recursions".
Support for Netty has been added. The previous "Servlet" probe and the Netty functionality were merged into the new "HTTP Server" probe.
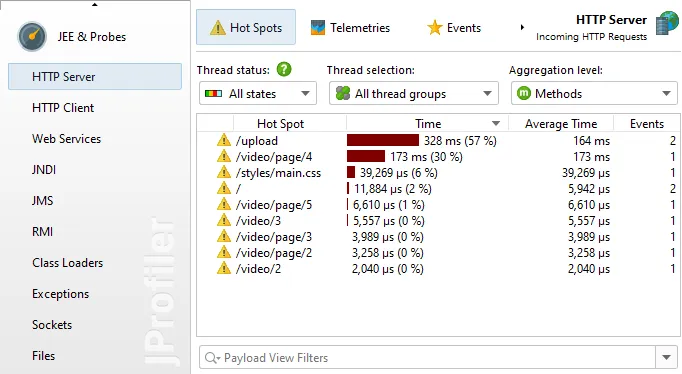
If you are running a Netty-based web server like Spring Reactor, Vertx or Ktor, the HTTP Server probe shows you the intercepted URLs with invocation counts and well as their total and average processing times.
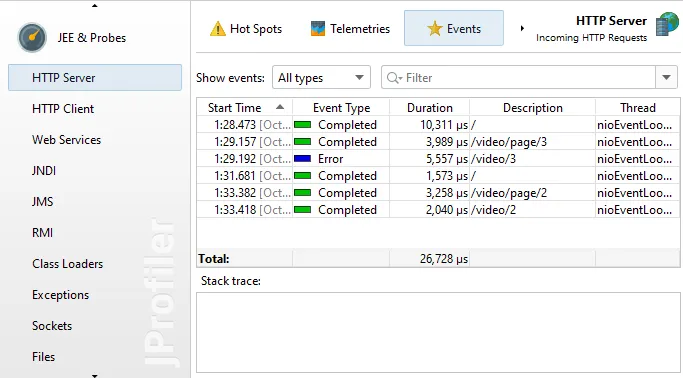
The events view of the HTTP Server probe can list the single URL interceptions chronologically.
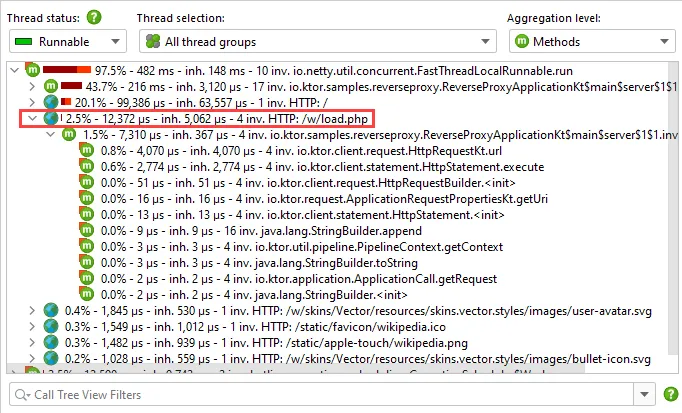
Just like for Servlet containers, the call tree is split for each URL, so you can see associated subtree separately.
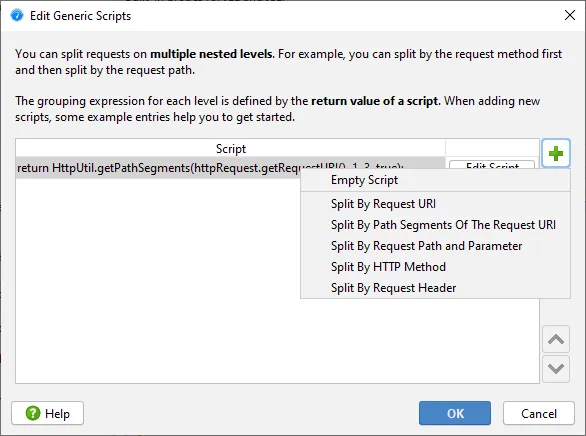
To determine the granularity of the split as well as the displayed URL, the probe settings of the HTTP server probe now offer generic splitting scripts in addition to the Servlet scripts.
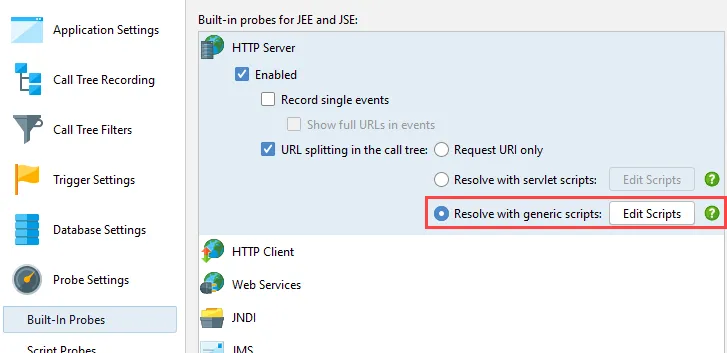
Unlike for Servlet scripts that offer the HttpRequest object from the Servlet API as a parameter, the Netty landscape is less stable with several incompatible APIs. This is why JProfiler offers an HttpRequest parameter from its own API to provide access to common request properties. Advanced use cases can get the underlying Netty request object via the getRequestObject() method.
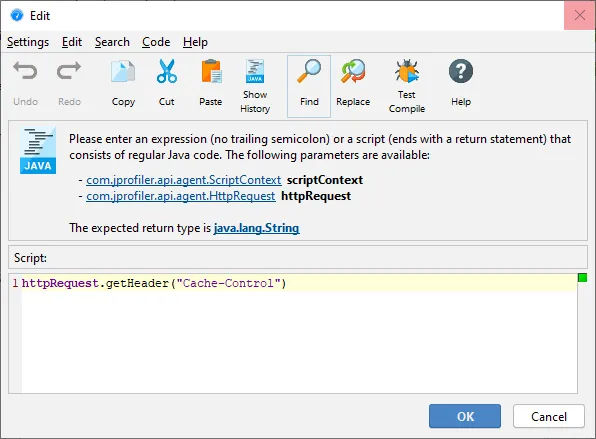
As with Servlet scripts, you can configure a list of scripts to create multiple nested splitting levels in the call tree. Several script templates for common tasks are available.
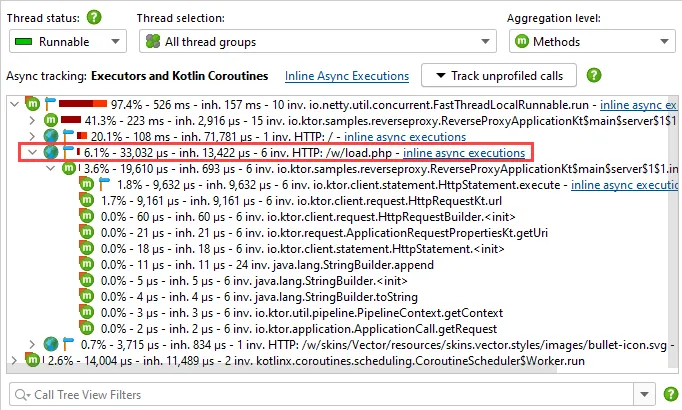
Netty is mostly used for async handling of HTTP requests. Because of the associated thread changes, the subtree below an URL in the call tree will not show the entire handling of the request.
With the async request tracking functionality in JProfiler, you can follow the entire execution flow. Most frameworks, like Spring Reactor use executors for async handling, so the "Executors" request tracking type has to be activated. If you are using a server based on Kotlin Coroutines like Ktor, then "Kotlin Coroutines" is the required tracking type.
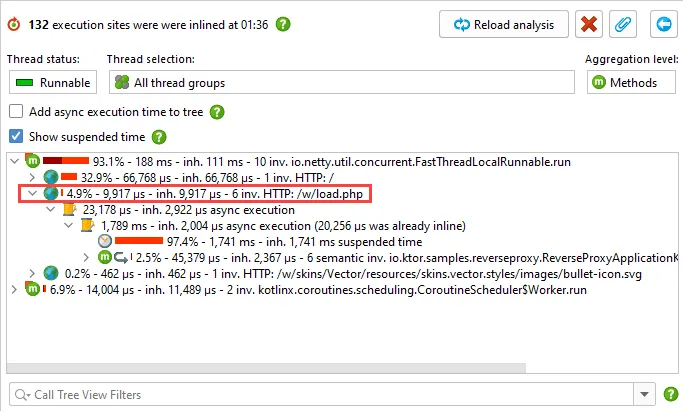
If async tracking is used, the call tree view will suggest to inline async executions both on top of the view as well as on the call sites where the async calls are initiated.
The result of the "Inline async executions" analysis then contains a single call tree across all involved threads that show you the entire handling of a particular request URL, cumulated for all matching requests.
Attaching to JVMs running in Docker containers is now supported in the SSH remote attach functionality.
You start out by using the quick attach functionality with an SSH tunnel to a remote Linux machine.
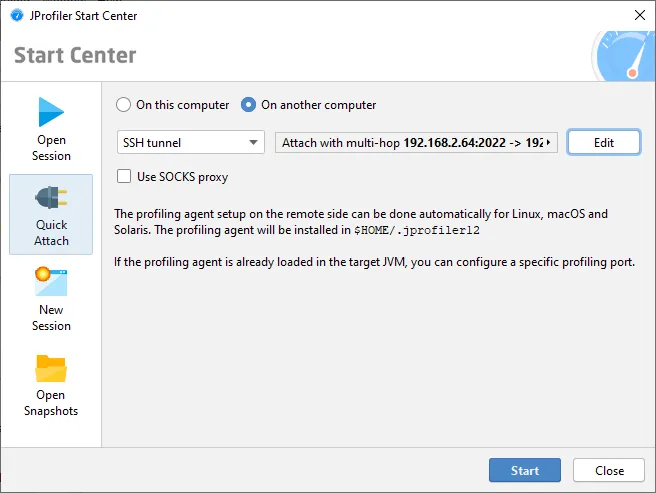
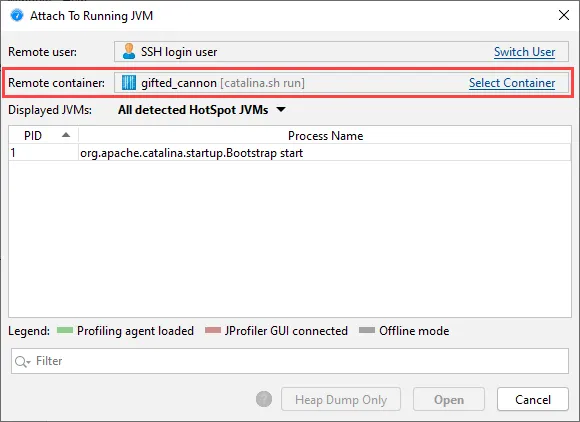
Initially, the JVM processes running directly on the remote machine are listed. At the top of the remote attach dialog is a line that shows the currently selected remote Docker container.

With the Switch container hyperlink you can then choose a running Docker container.
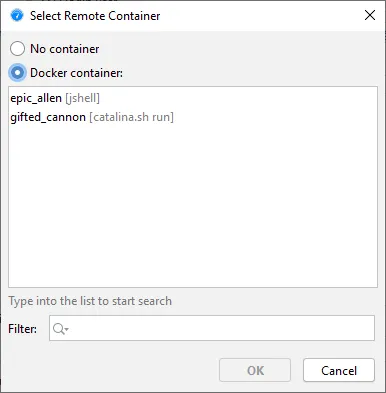
After selecting a Docker container, all JVMs that are running in it are shown. JProfiler will then use Docker commands to automatically install the profiling agent in the selected container, prepare the JVM for profiling and tunnel the profiling protocol to the outside.
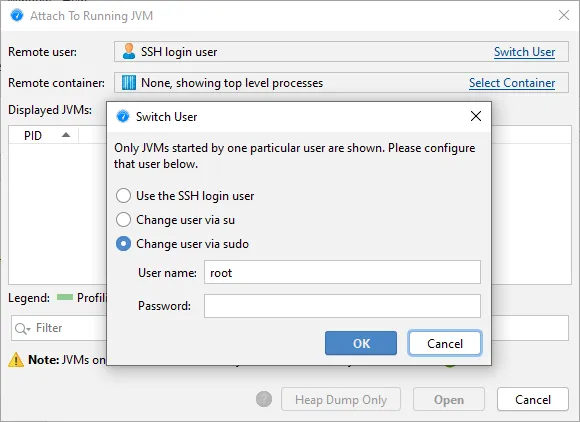
If the SSH login user is not in the docker group, you can switch the remote user first.
Attach functionality has been improved in several ways.
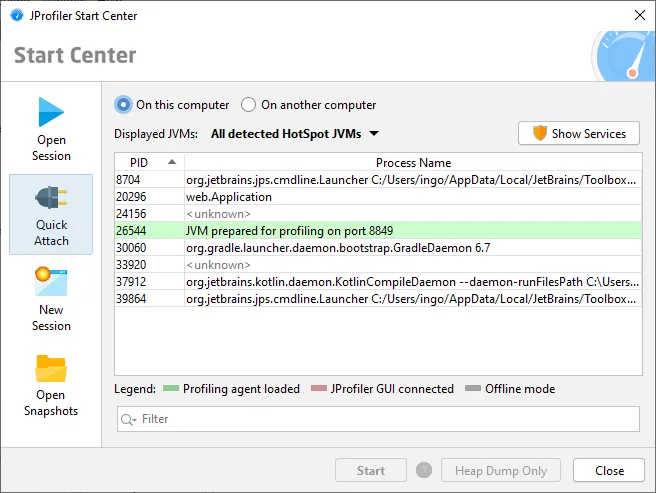
JVMs that have been started with the "-agentpath" VM parameter for profiling are now shown in the attach dialog, both for local and remote attach. These JVMs are waiting at startup for a connection from the JProfiler GUI. In that state, the normal attach mechanism in the JVM is not yet available, so an alternative attach mechanism had to be implemented.
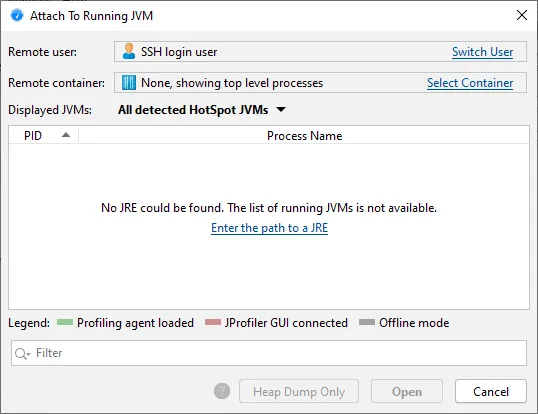
Previously, when connecting to a remote machine, a JRE had to be available for the login user, or the connection would fail. Starting with this release, a message is shown in the JVM list with a hyperlink to manually enter a path to a JRE. This allows you to switch to a user that may have access to a JRE or switch to a Docker container that contains a JRE.
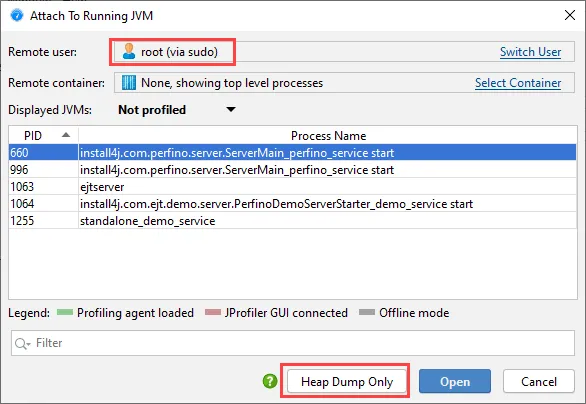
Previously, when changing the user on the remote machine, no HPROF snapshots could be taken. In this release, a method to transfer the heap dump data between accounts has been implemented and the "Heap dump only" action is now enabled.
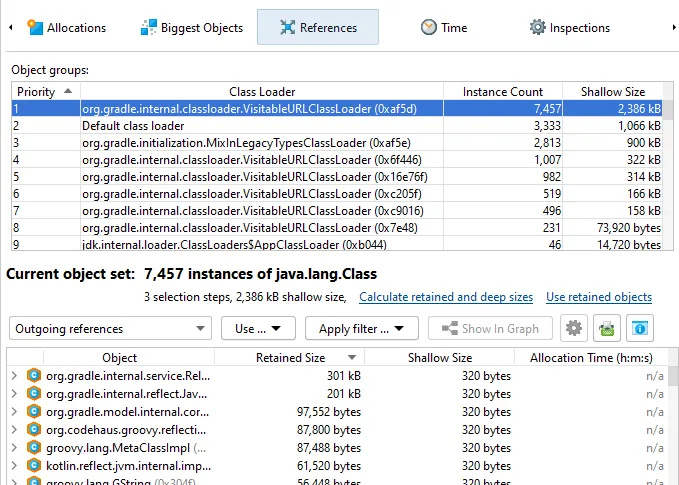
An inspection to group classes by their class loader has been added to the heap walker. This inspection groups java.lang.Class objects and is complementary to the existing inspection that can group instances by their class loader.
The result of the inspection can either include classes whose java.lang.Class objects are contained in the current object set or classes that have instances in the current object set.
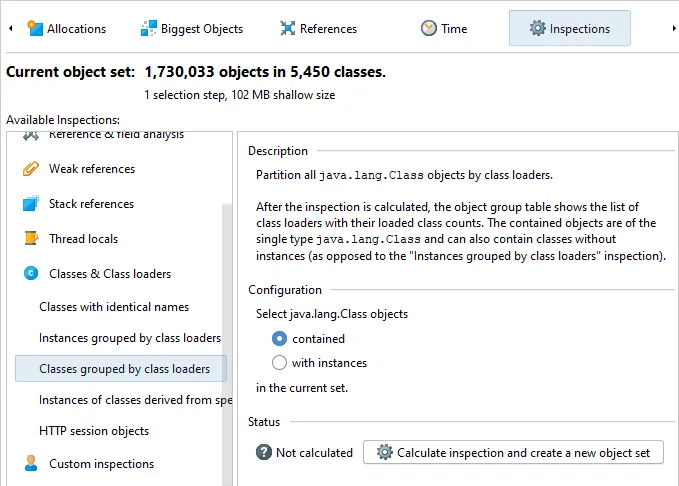
When you select a class loader in the grouping table at the top, the corresponding java.lang.Class objects are shown in in the data views below.
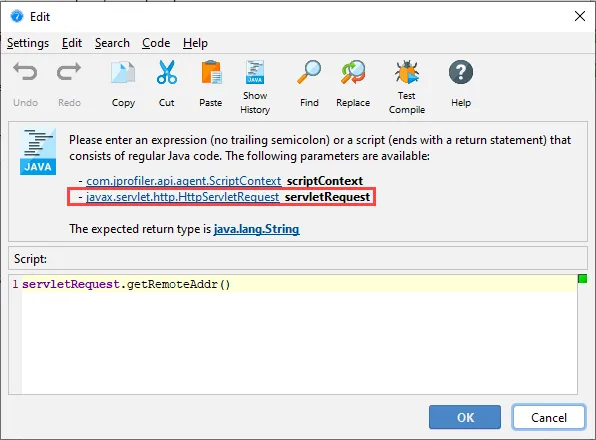
Jakarta EE 9 is now supported. Jakarta EE 9 switches the packages for the API from javax.* to jakarta.*. JProfiler now supports both the old as well as the new packages for the "HTTP server" probe.
When writing URL splitting scripts in the JProfiler UI, a javax.servlet.http.HttpServletRequest request object is available as a parameter. If the profiled container supports Jakarta EE 9, calls into the servlet API are transparently translated into the jakarta.servlet. namespace.
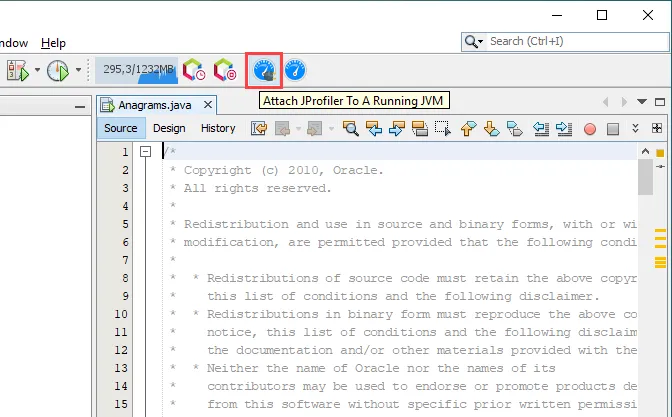
The NetBeans plugin has been improved. An action has been added to attach to a running JVM. This is especially important for profiling Maven projects that do not use the exec plugin as well as Gradle projects where the JProfiler plugin has no way to insert VM parameters into the Java invocation.
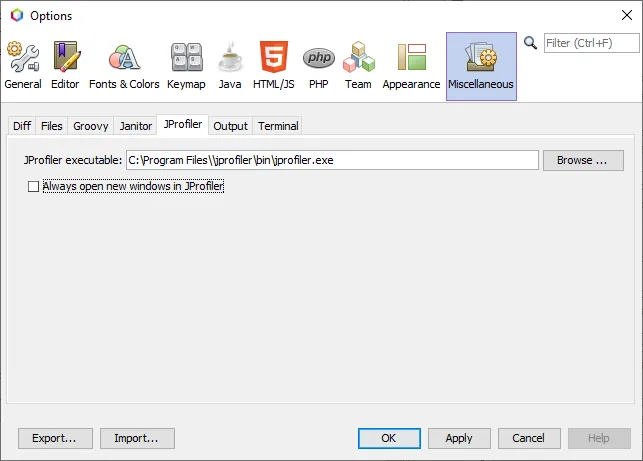
A preference page has been added where you can adjust the JProfiler executable as well as the window policy for opening new profiling sessions. All other settings continue to be available the session startup dialog and are saved separately for each NetBeans project.
JProfiler has a new cross-platform light mode. This the new light look and feel from the IntelliJ IDEA platform.
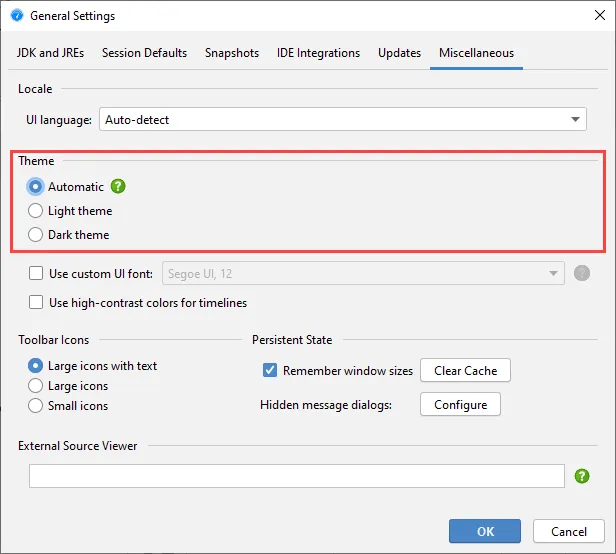
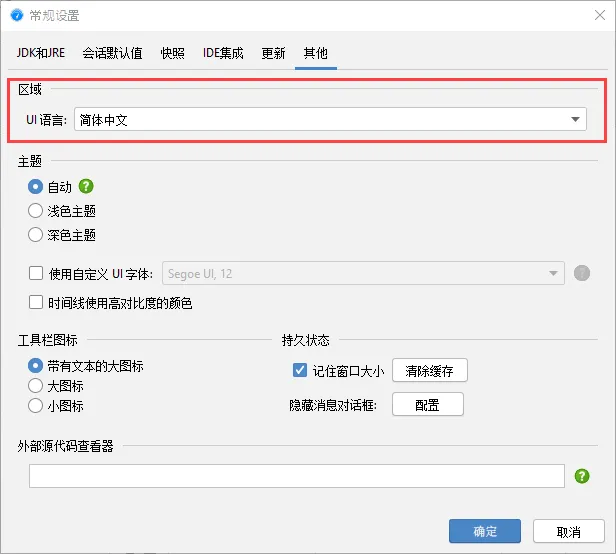
A localization into simplified Chinese has been added. If the locale of your machine is "zh_CN", the installer will pick it up automatically, otherwise you can switch languages in the general settings dialog.
Support for profiling on Alpine Linux has been added. Alpine Linux is especially popular for Docker because of its smaller image size. It uses a different C standard library than other Linux distributions, so the native profiling agent needs a separate port.
Starting with this release, the musl-x64 architecture is included in JProfiler.
Support for profiling on macOS ARM has been added. While profiling JVMs compiled for the x86 architecture is possible on new ARM-based macOS machines via Rosetta, new JVMs compiled directly for the new ARM architecture require a different native profiling agent.
Starting with this release, the macOS profiling agent is a universal binary that contains implementations for both x64 and ARM64.
At the time of the 12.0 release, JProfiler is not bundled with an ARM JRE yet, so the JProfiler GUI will run via Rosetta on macOS ARM machines. A release that includes an ARM JRE is expected shortly as corresponding JREs become available.