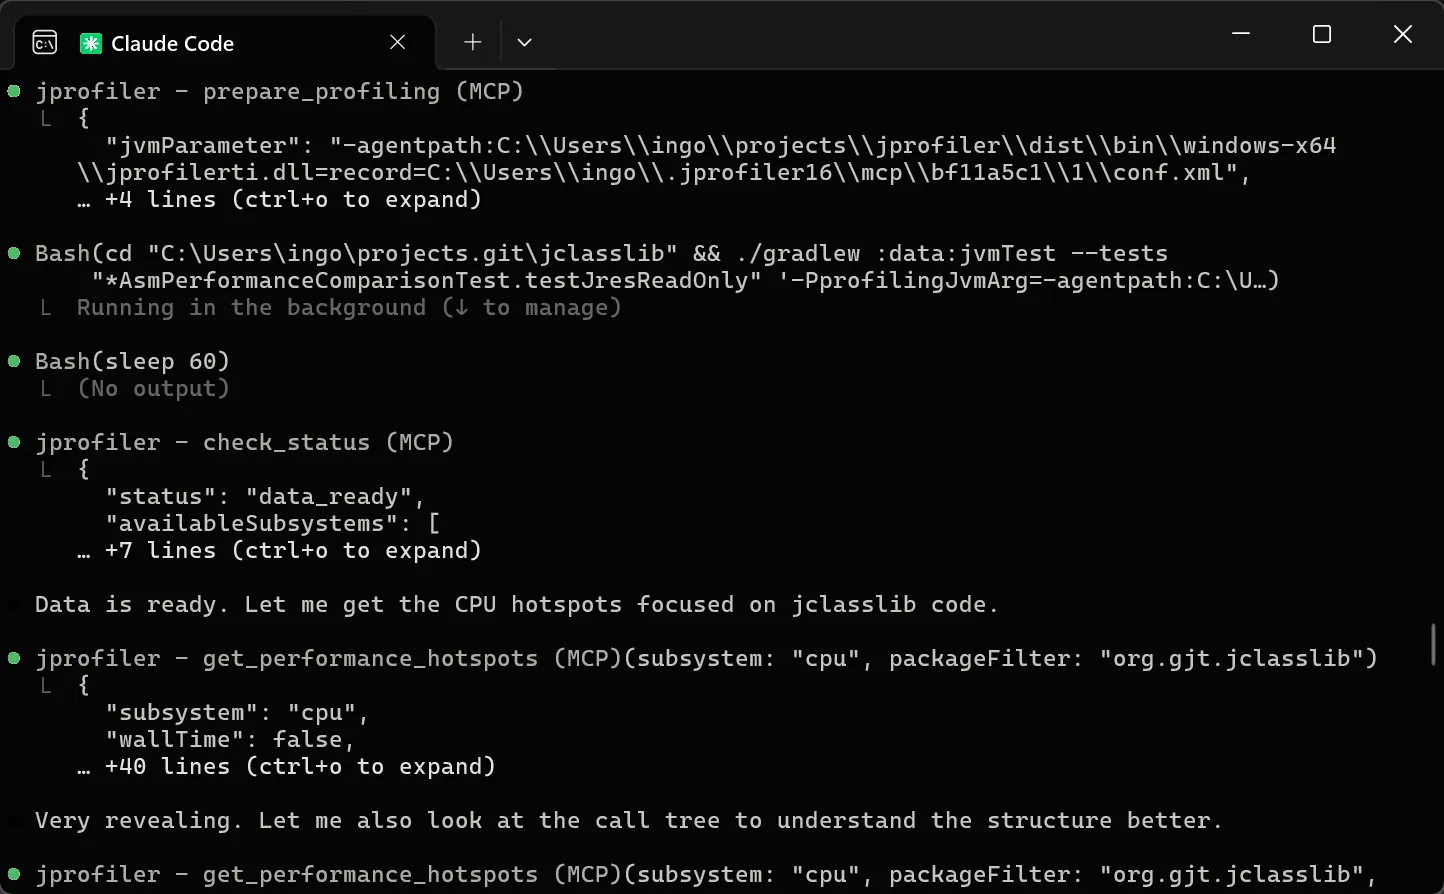
JProfiler 16 introduces an AI probe. The probe measures interactions with LLMs via LangChain4j
and Spring AI.
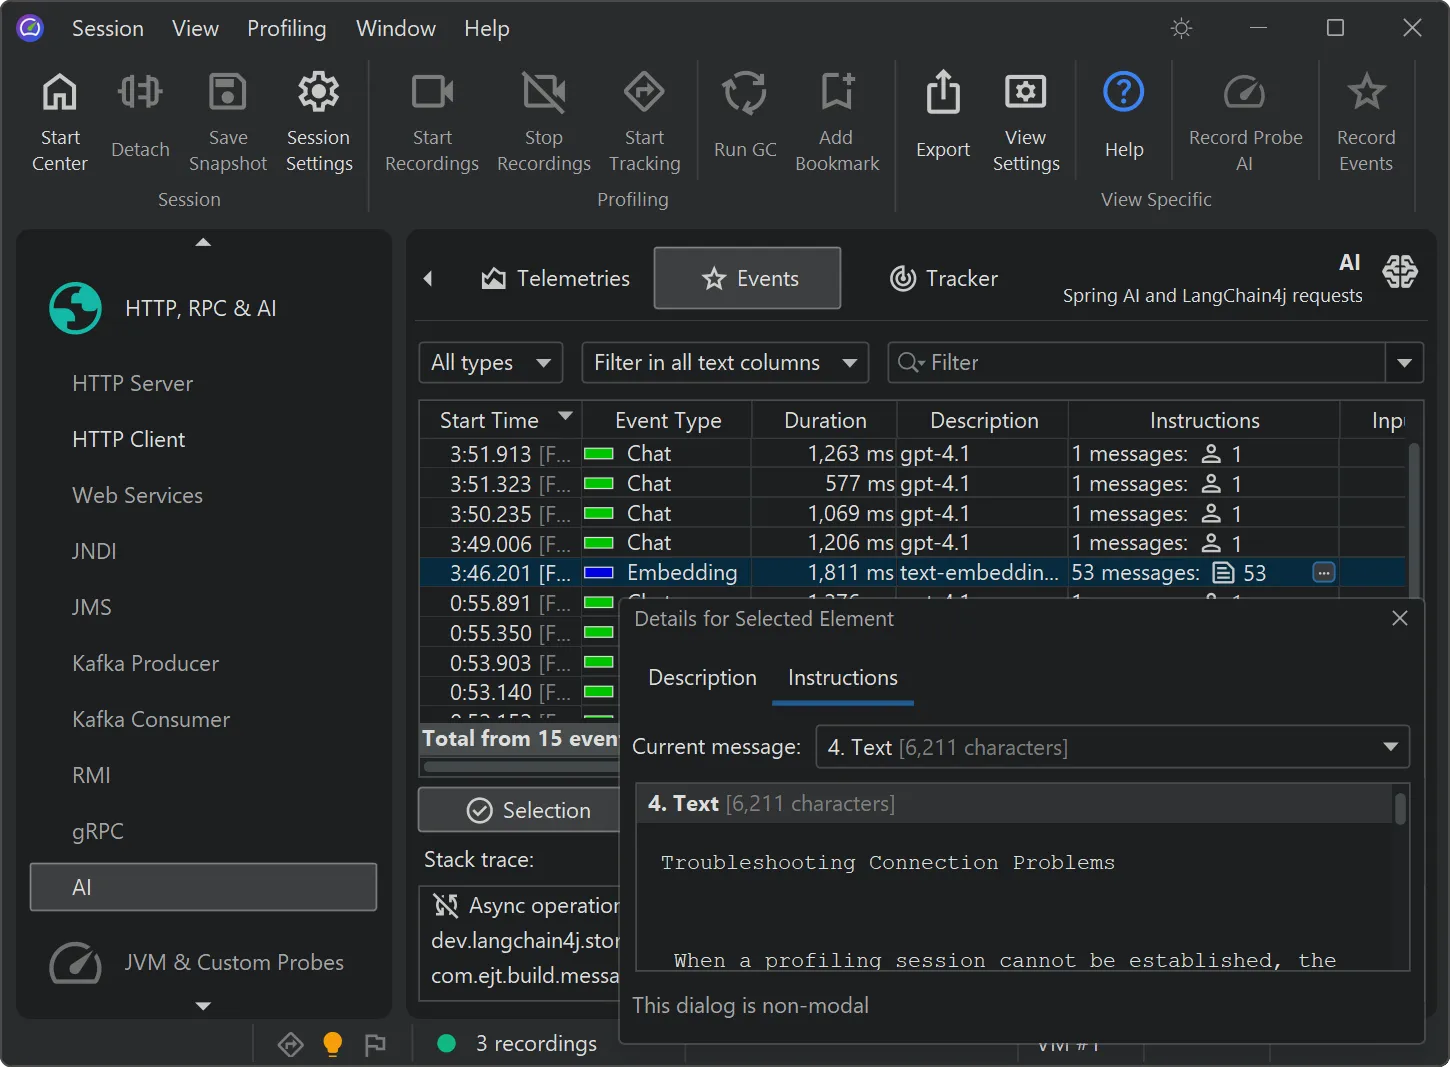
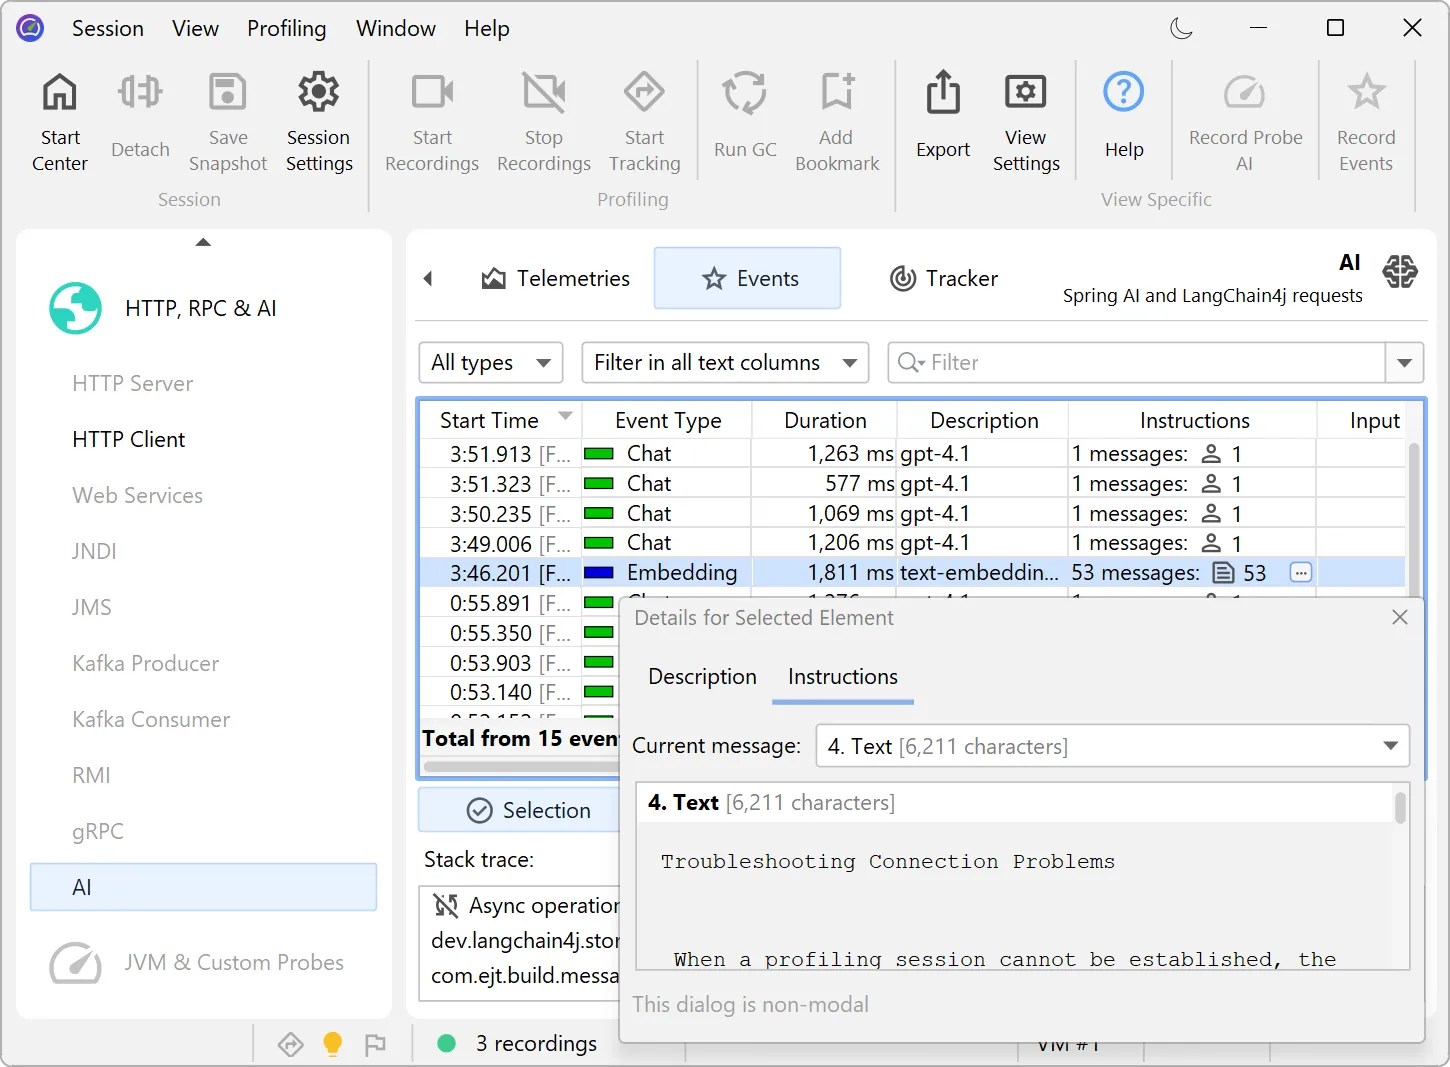
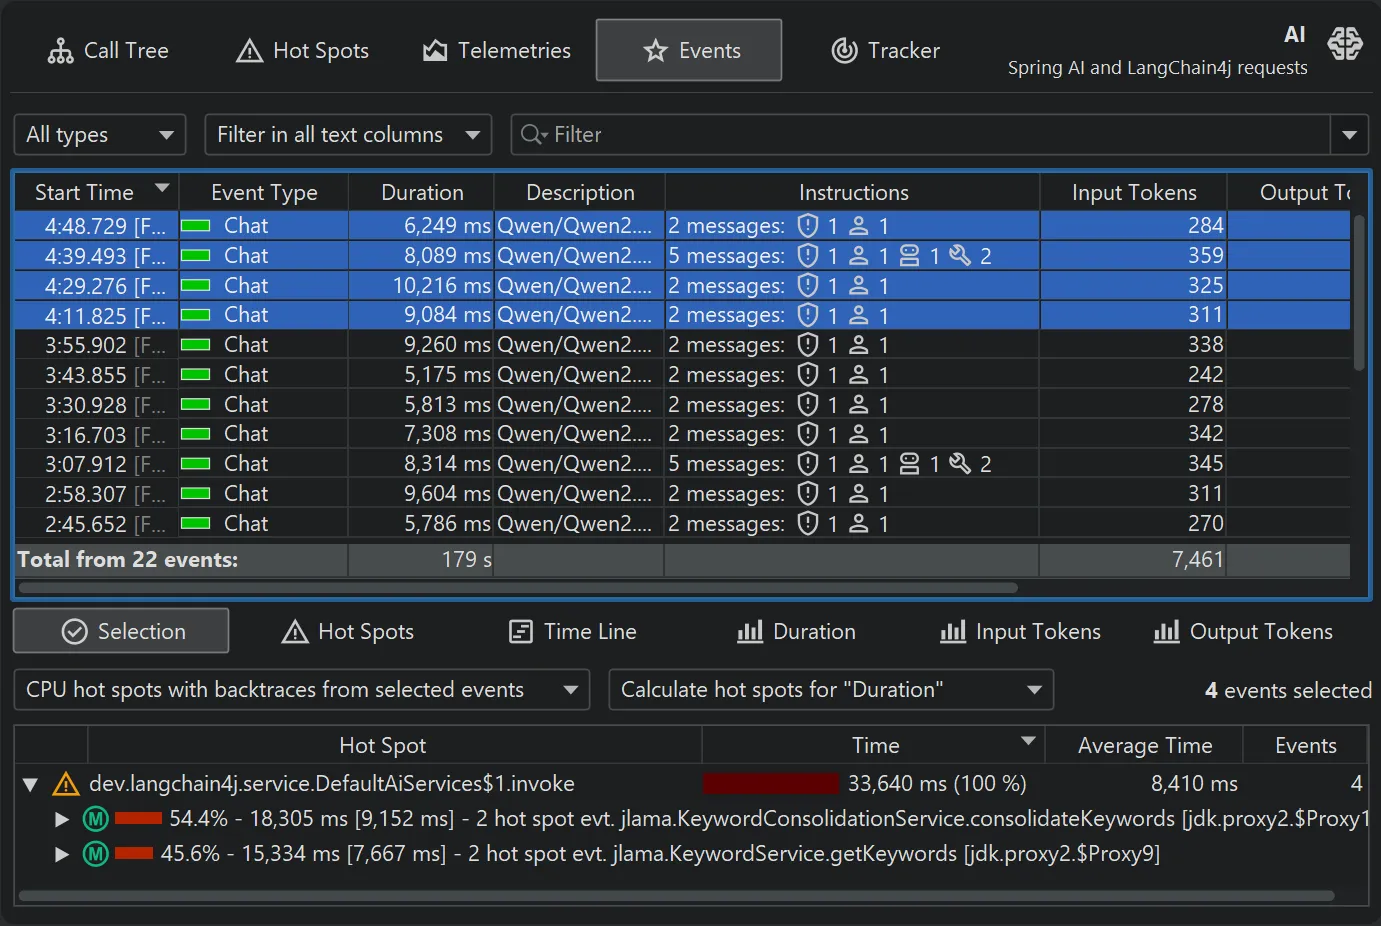
Chat requests and embeddings are supported and shown in the events view as different event types.
Details for the processed instructions are available in the node detail dialog that can be shown with the hover button in the instructions
column. The instructions column shows statistics for the different instruction types, such as user messages, assistant messages, or
tool messages.
The AI probe is event-centric. You can work with subsets of recorded events in two ways: First, when you select multiple events, the
selection panel at the bottom provides CPU hot spots, probe hot spots, and a probe call tree for the current selection.
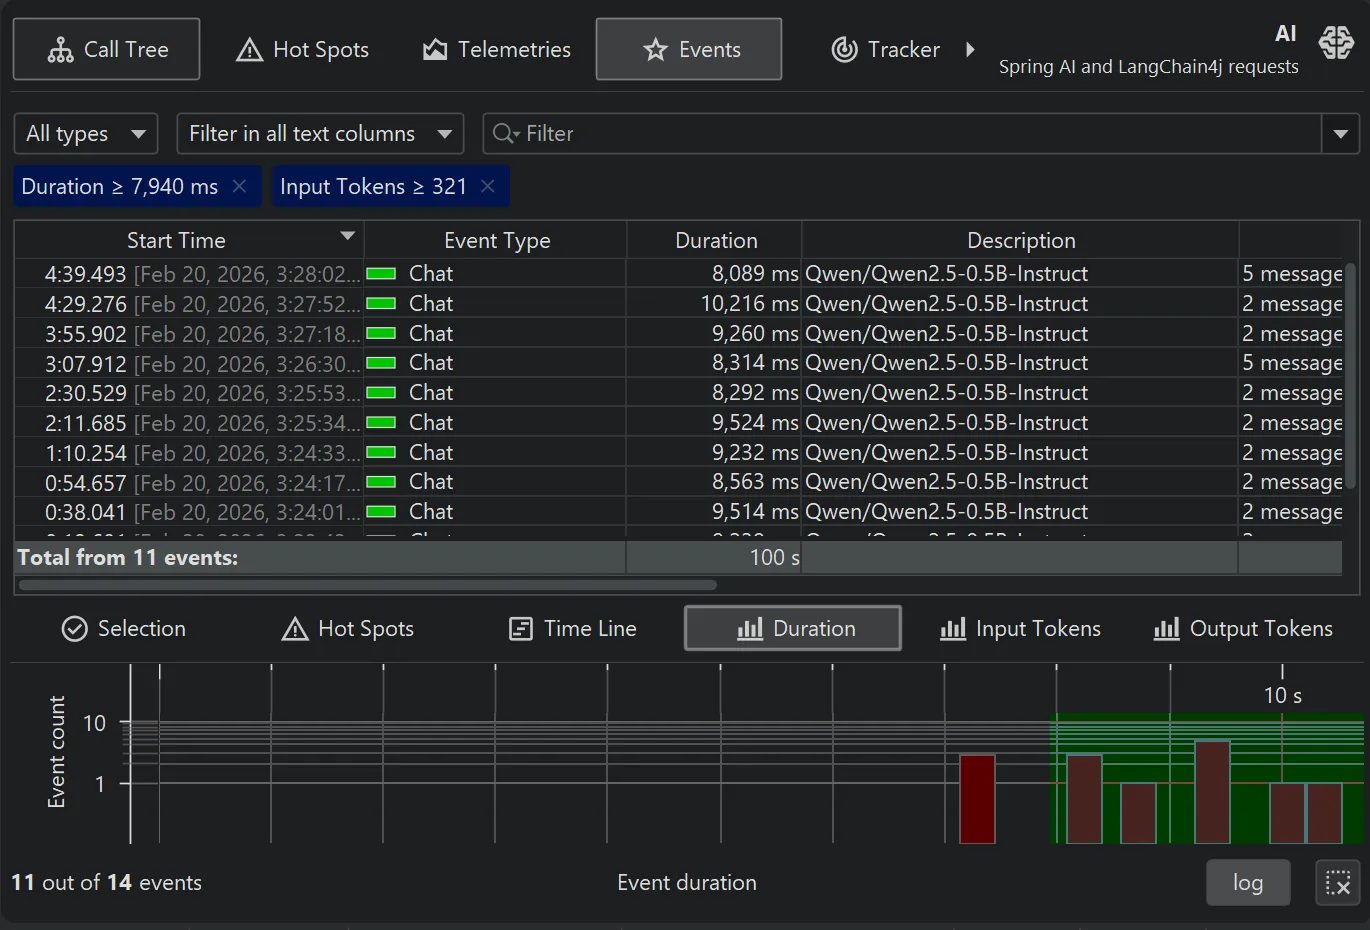
For more thorough investigations, the filter selector at the top and the various tabs in the lower section allow you to restrict the set of events
in the main table and associated views.
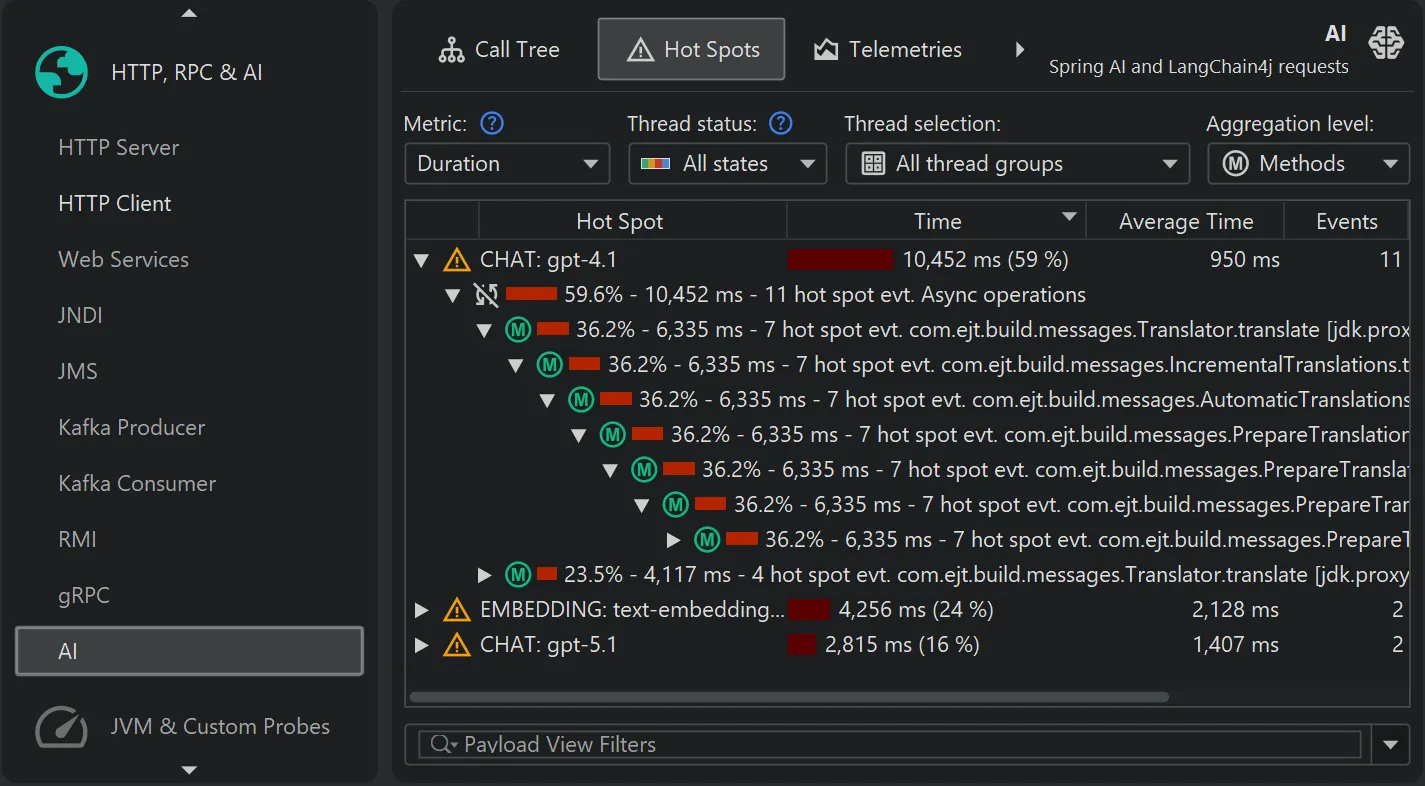
By default, the AI probe identifies hot spots based on the specific model names that processed the request. This data is available
not only in the events view, but also in the hot spot view of the AI probe, even if no events are recorded.
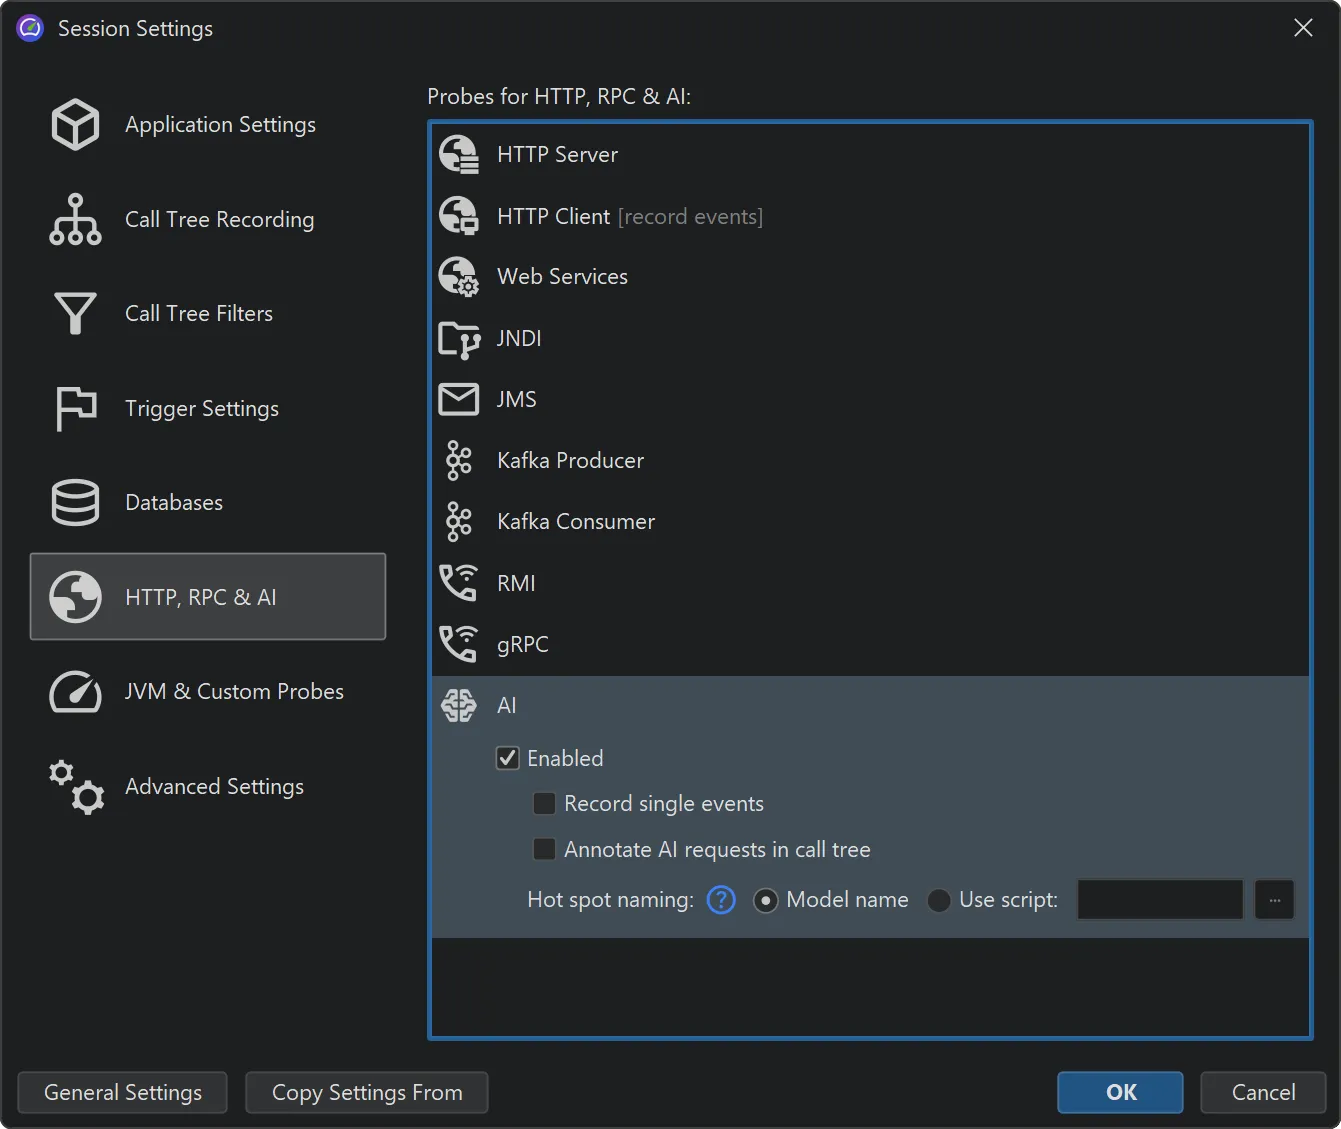
Model name hot spots are only one of many potentially interesting types of hot spots. In the probe settings, you can configure
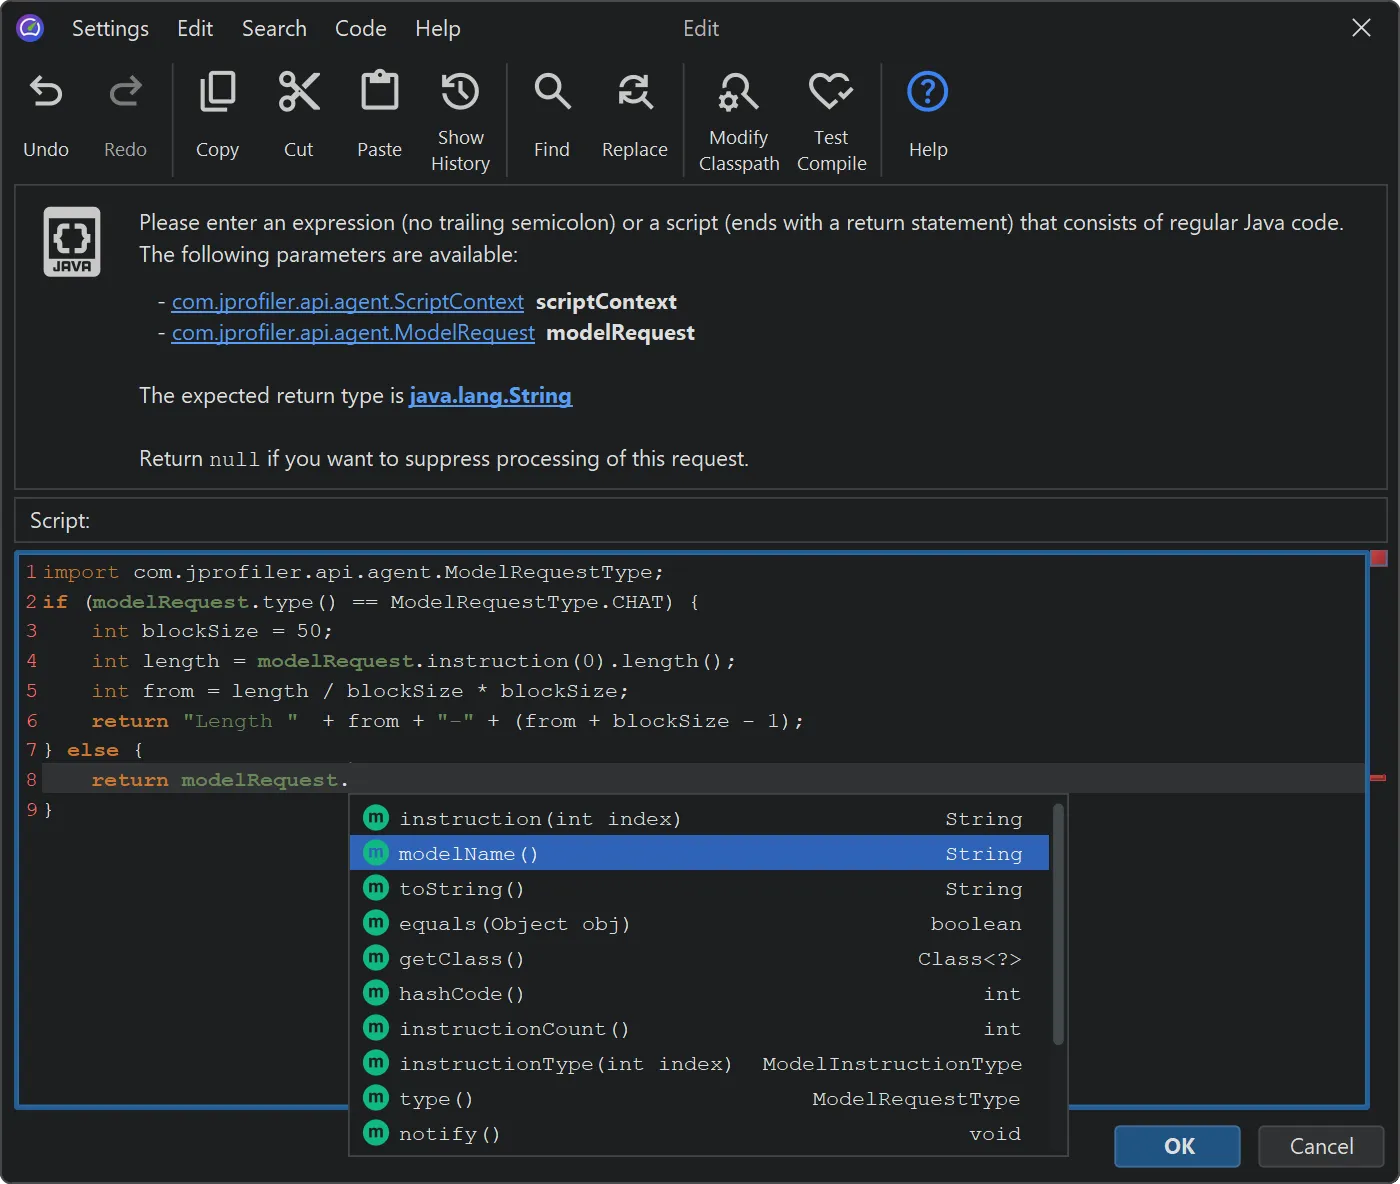
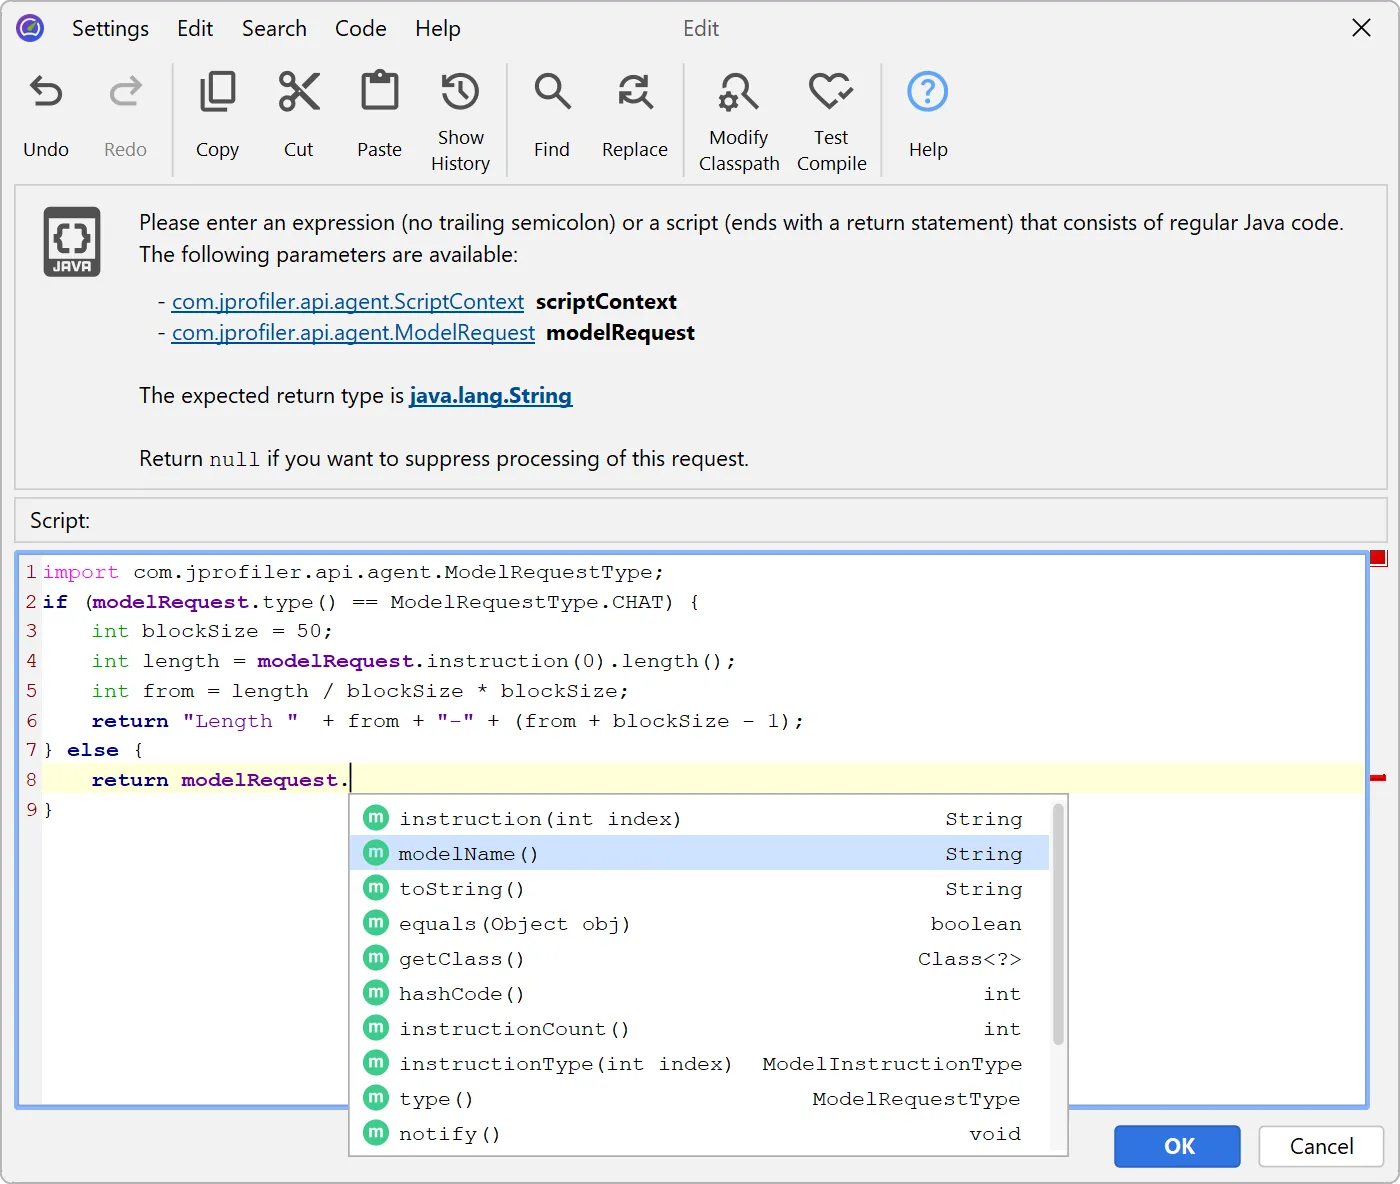
a script to calculate user-defined types of hot spots by entering some Java code in JProfiler's powerful script editor.
When an AI probe event is recorded, JProfiler invokes this script with a ModelRequest parameter. This parameter provides
access to the request type, the model name, and all instructions along with their instruction types.
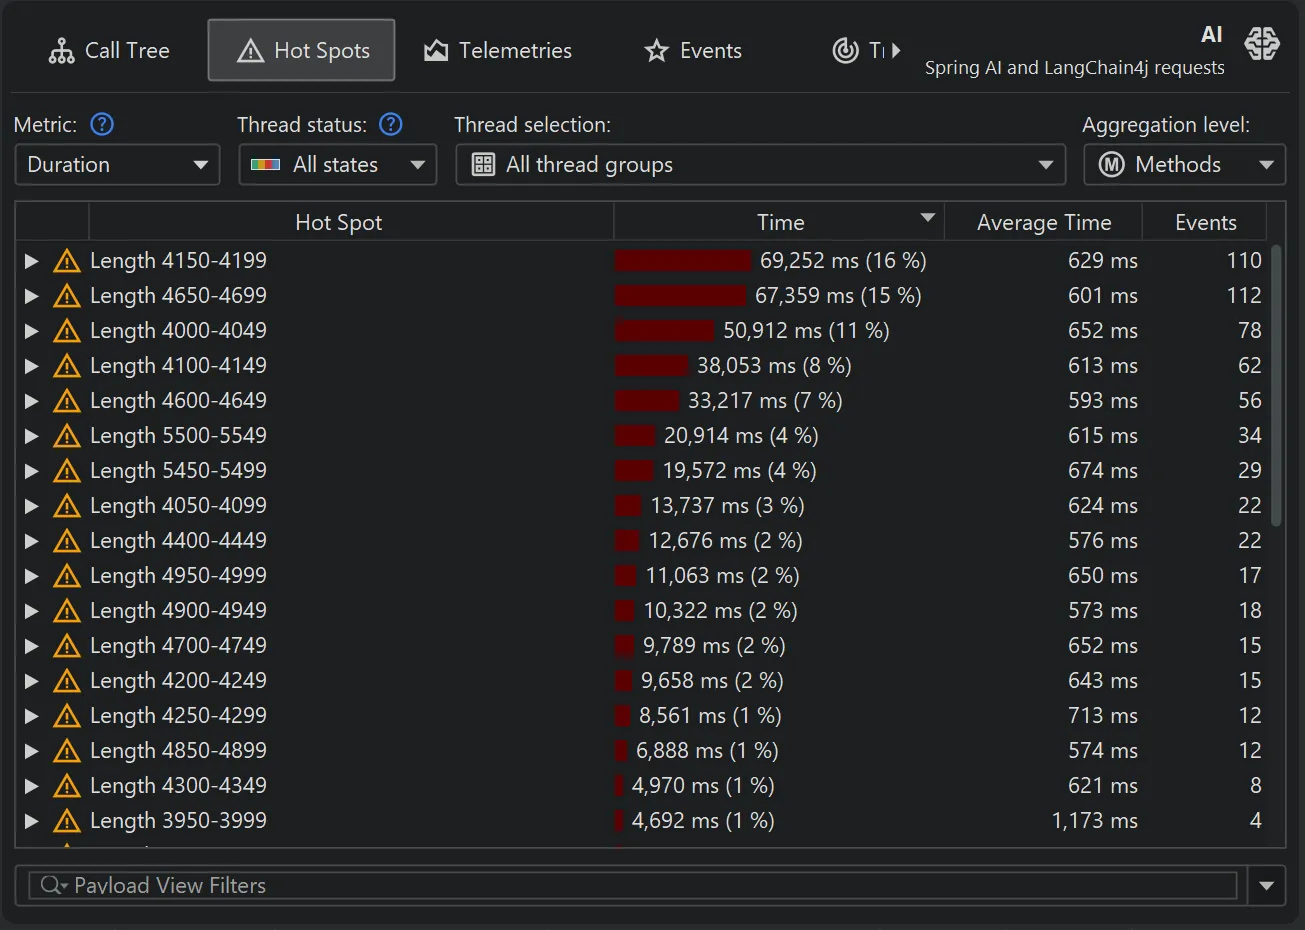
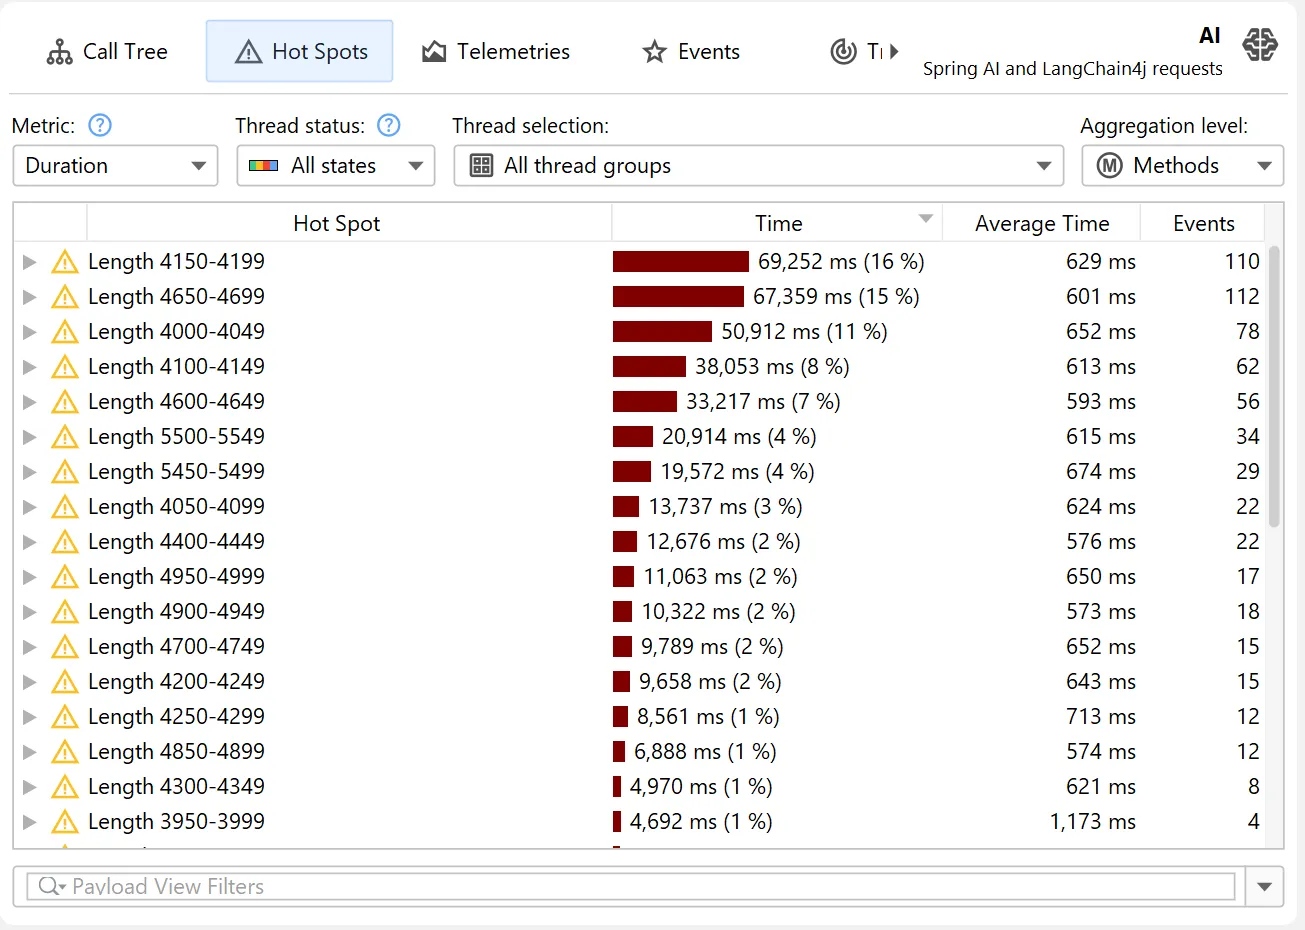
For example, you could define hot spots by grouping prompt lengths into 50-character buckets. The example below demonstrates how this is done.
Since JProfiler displays data live during recording, you can change these settings while profiling and observe the effects immediately.
With the above script, the new hot spots look like this:
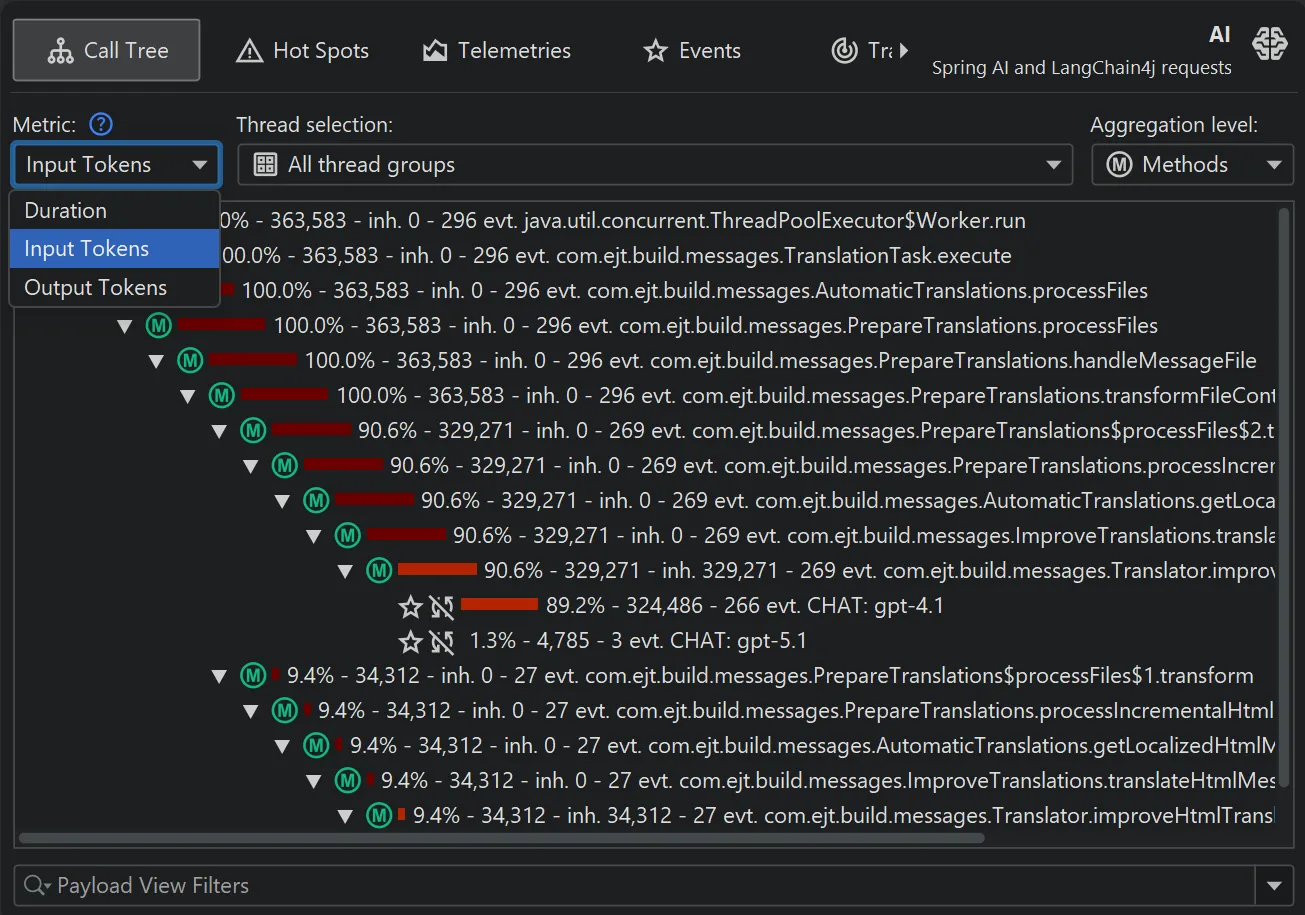
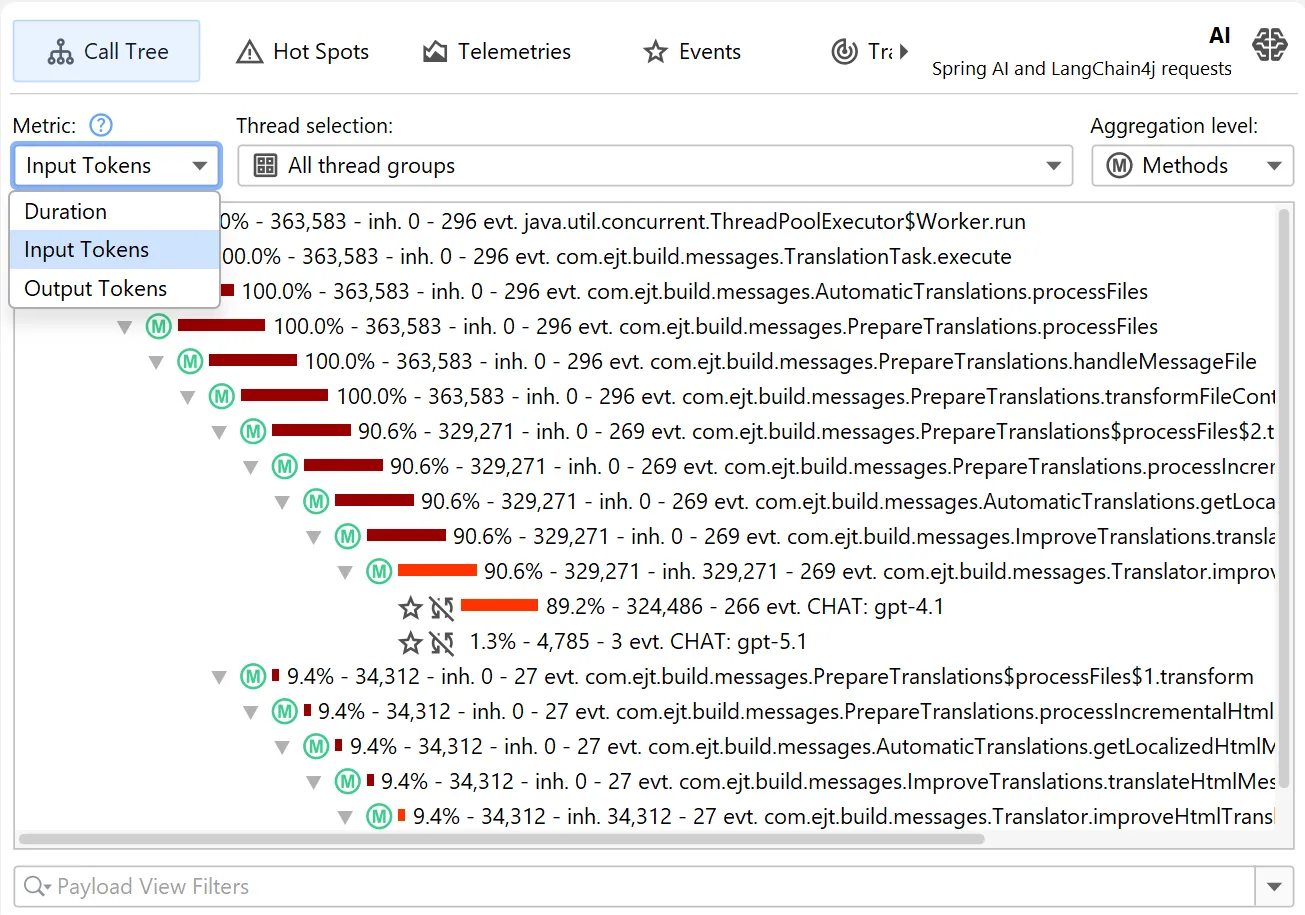
By default, hot spots focus on the request duration, but you can switch the primary measurement to input tokens and output tokens
as well.
This is possible both in the probe hot spots view and the probe call tree view. The probe call tree view shows a top-down view
connecting method calls to probe payloads.
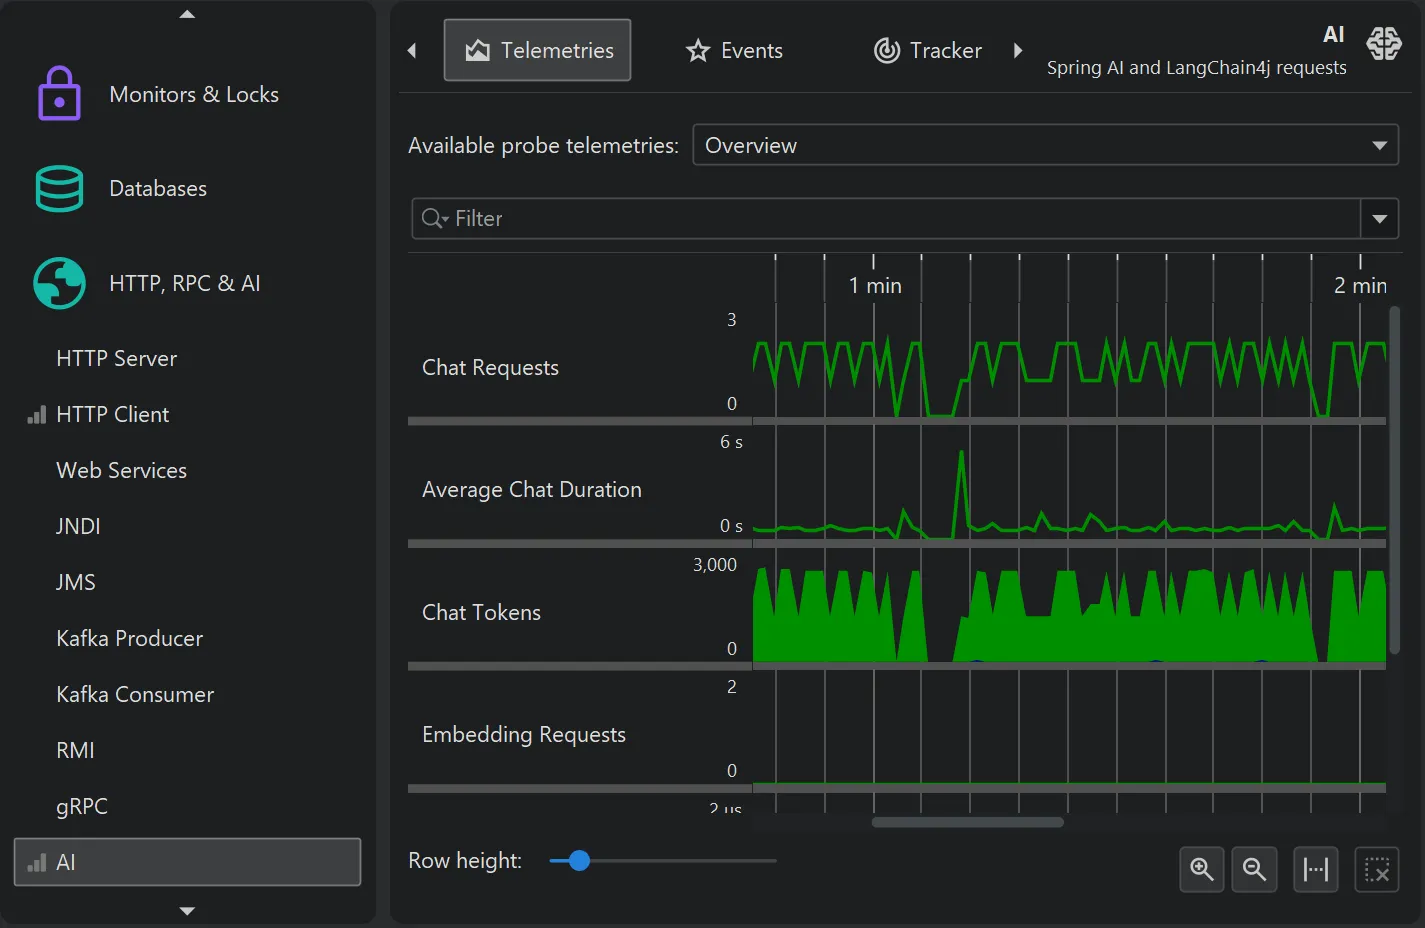
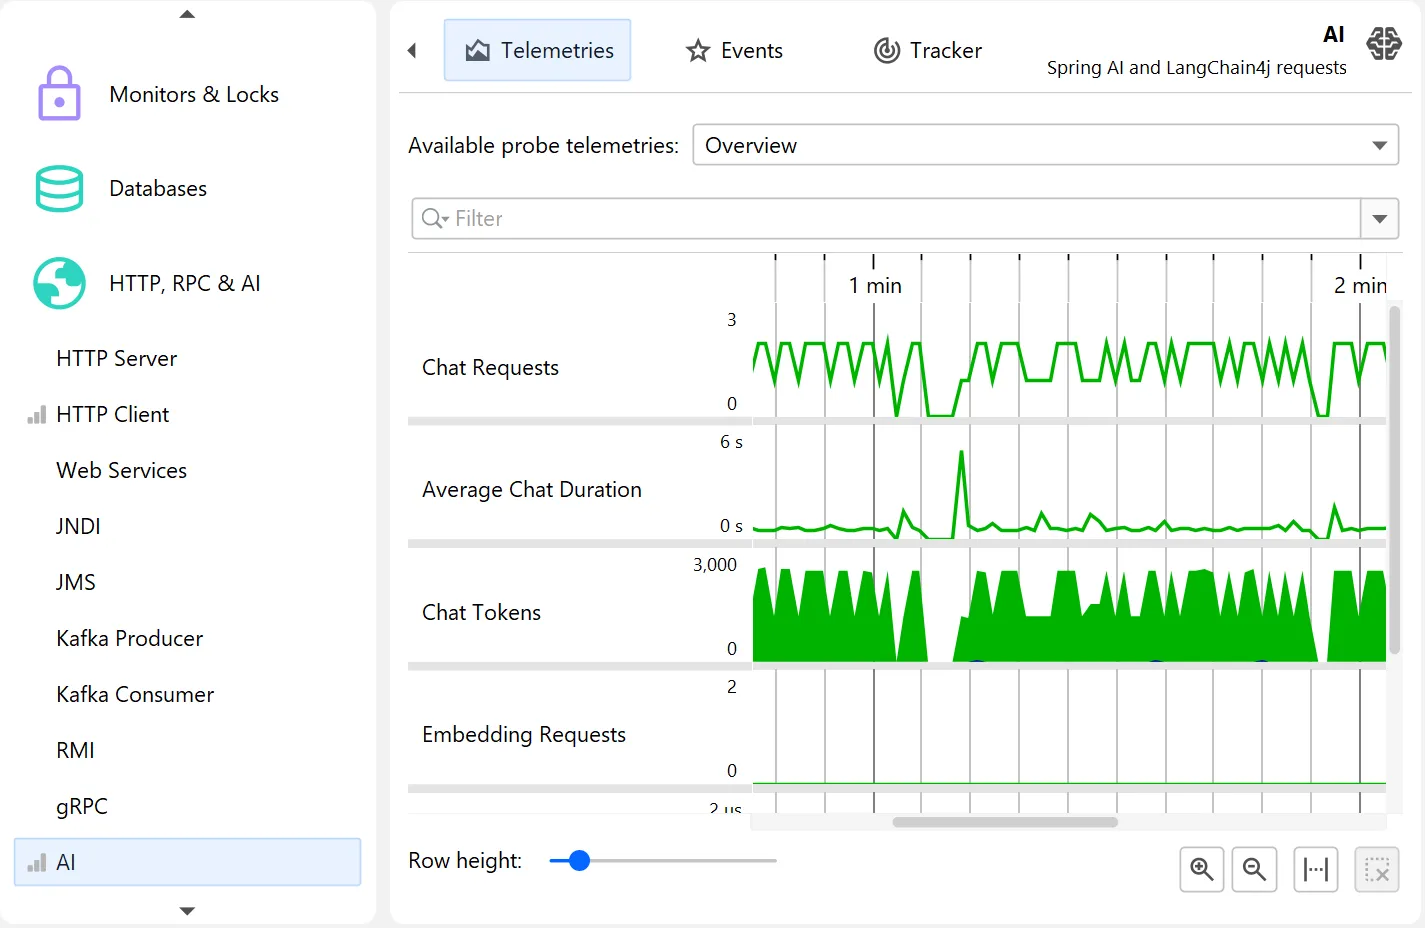
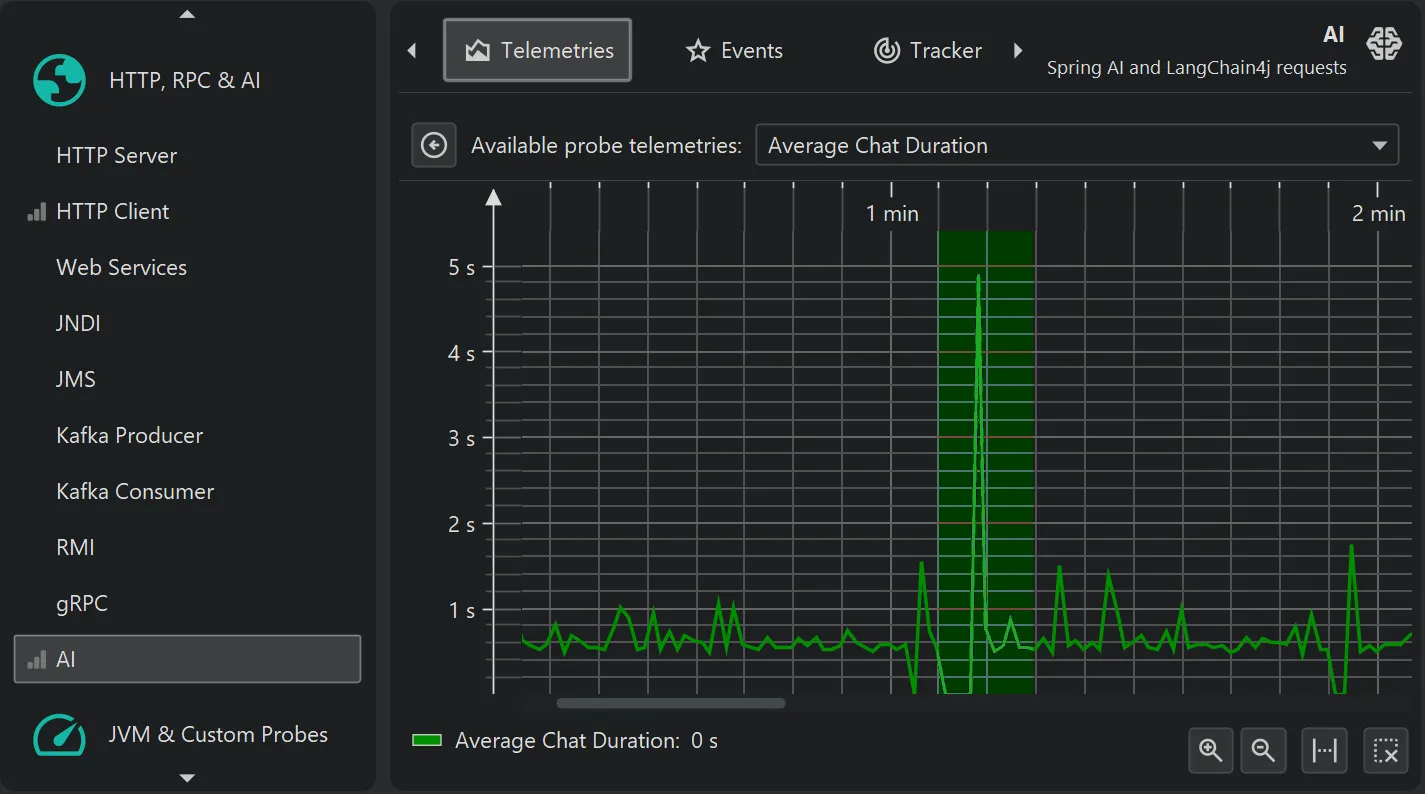
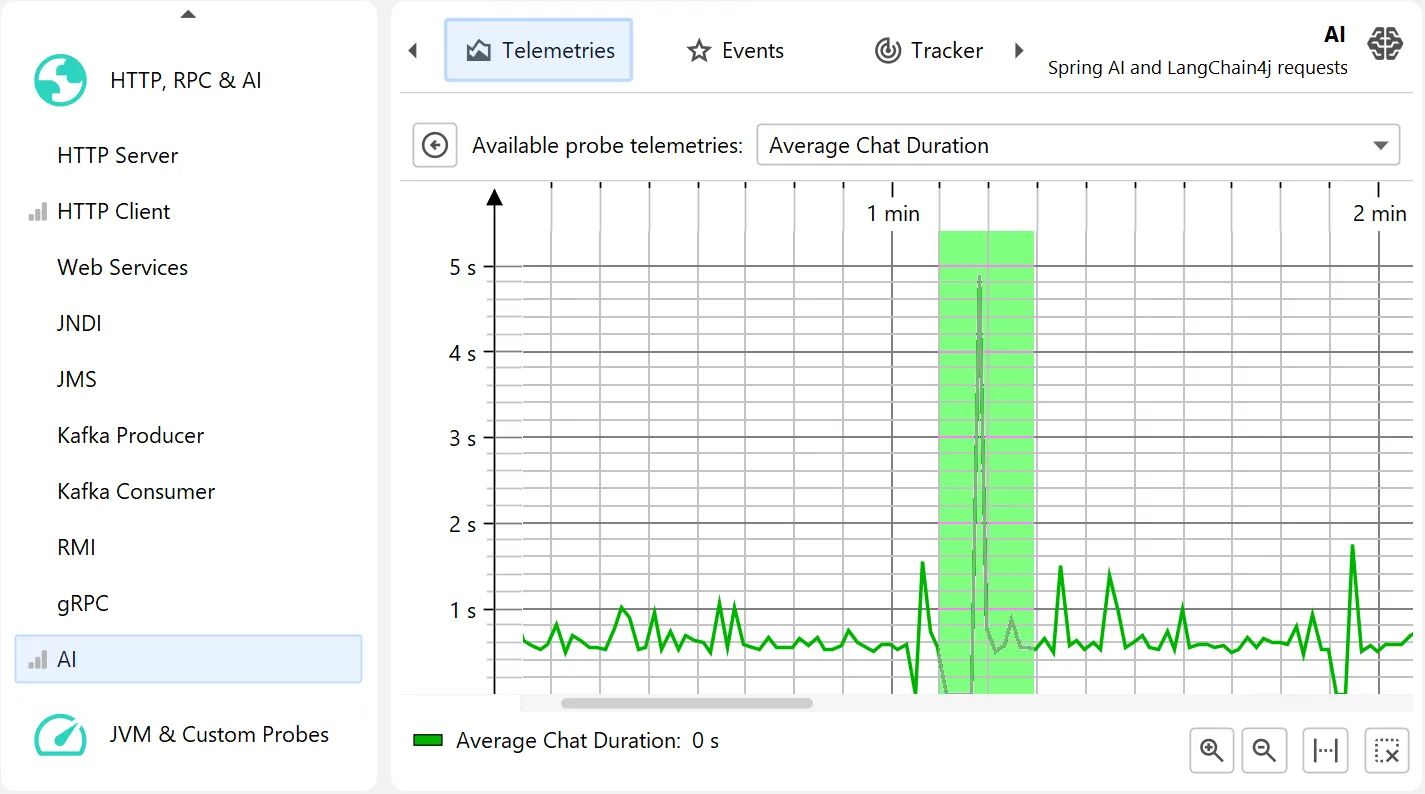
The probe telemetries for the AI probe show request counts, average request duration, and a combined input/output token graph separately for
chat requests and embedding requests.
Each telemetry can be shown separately and can be used to select events for particular areas of interest.
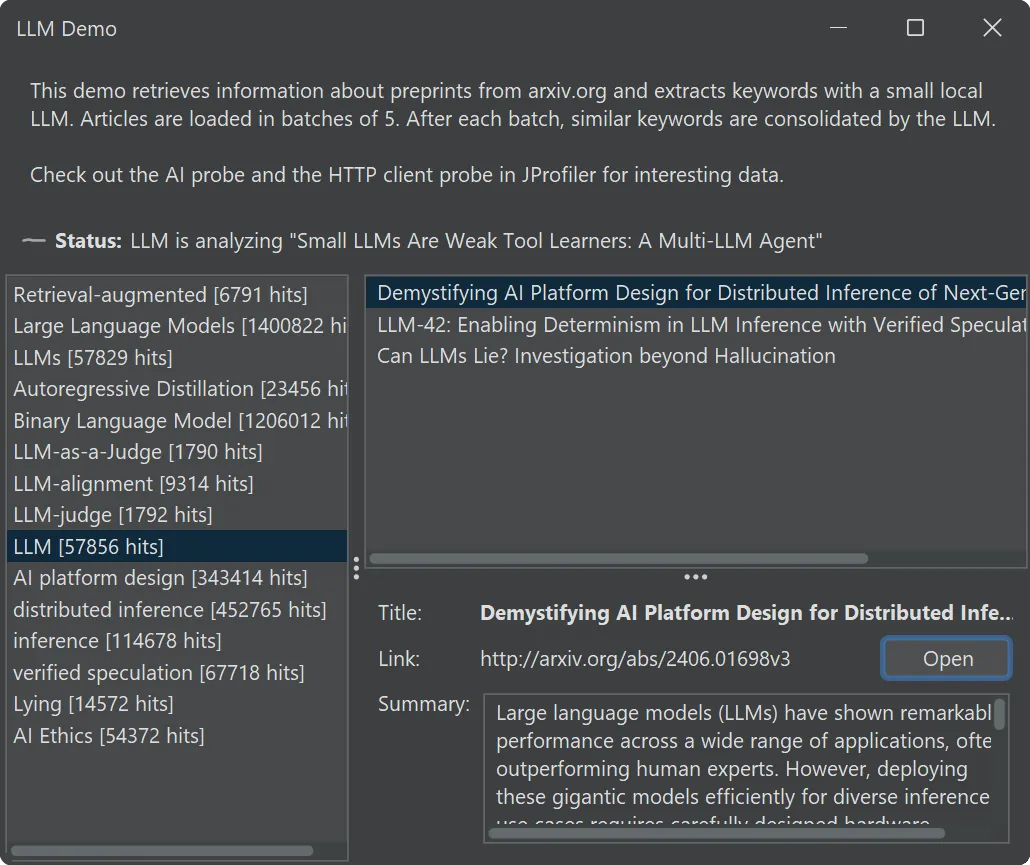
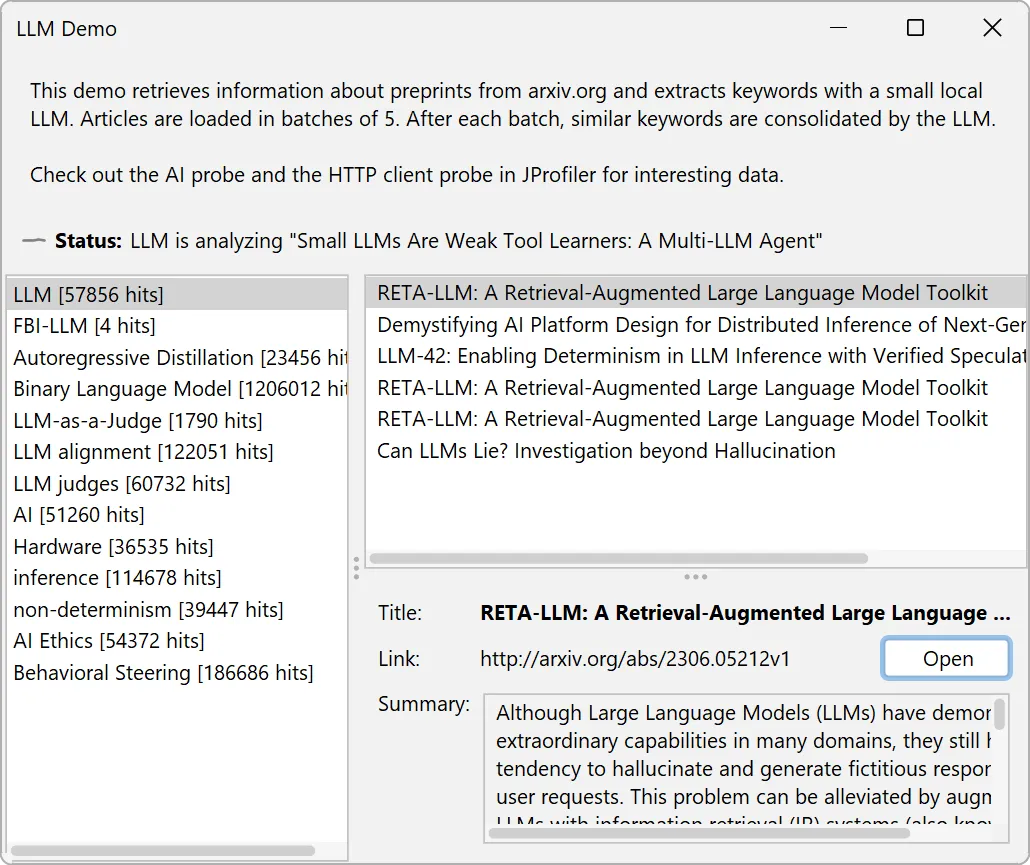
To help you explore the AI probe, JProfiler now comes with an "LLM demo" session.
It uses Jlama, a cross-platform inference engine for Java 21+ and downloads
a 0.5-billion-parameter model from Hugging Face to categorize LLM-related preprints from
arXiv.
The demo features a UI where keywords produced by the LLM are continually inserted and you can explore the associated research papers
on the right.
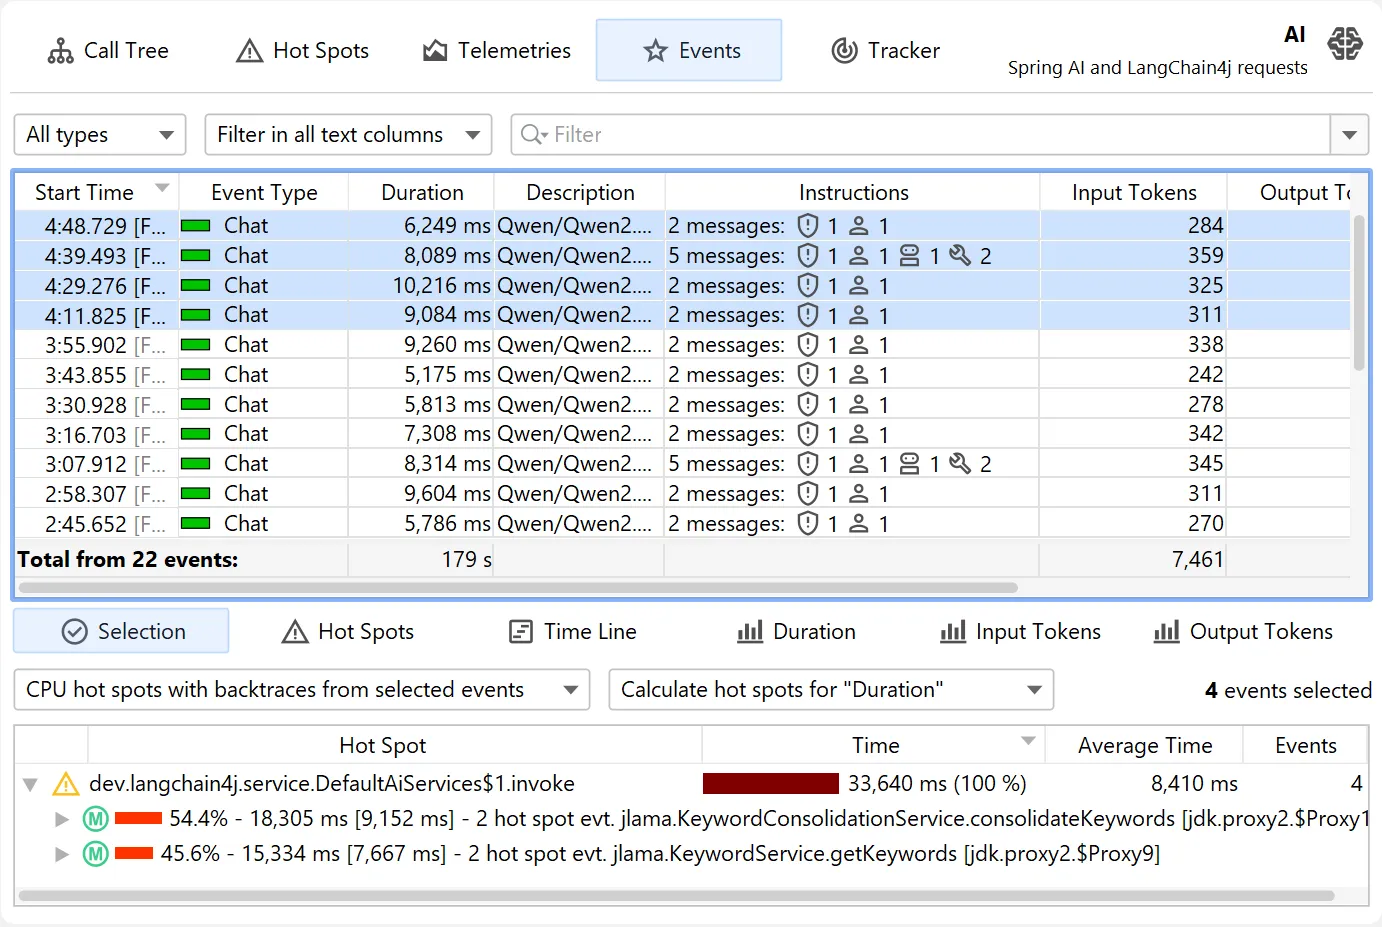
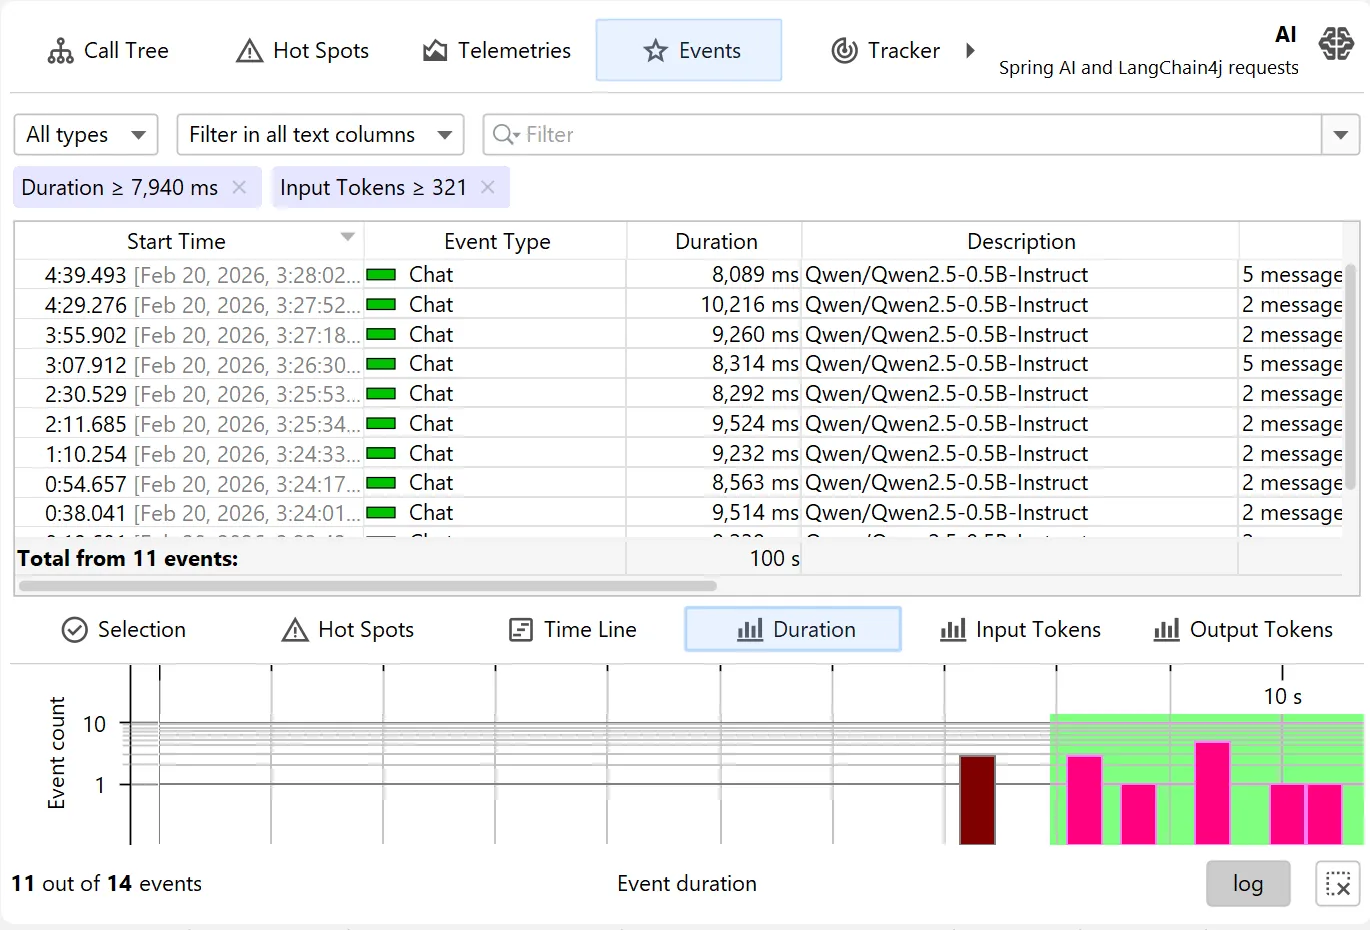
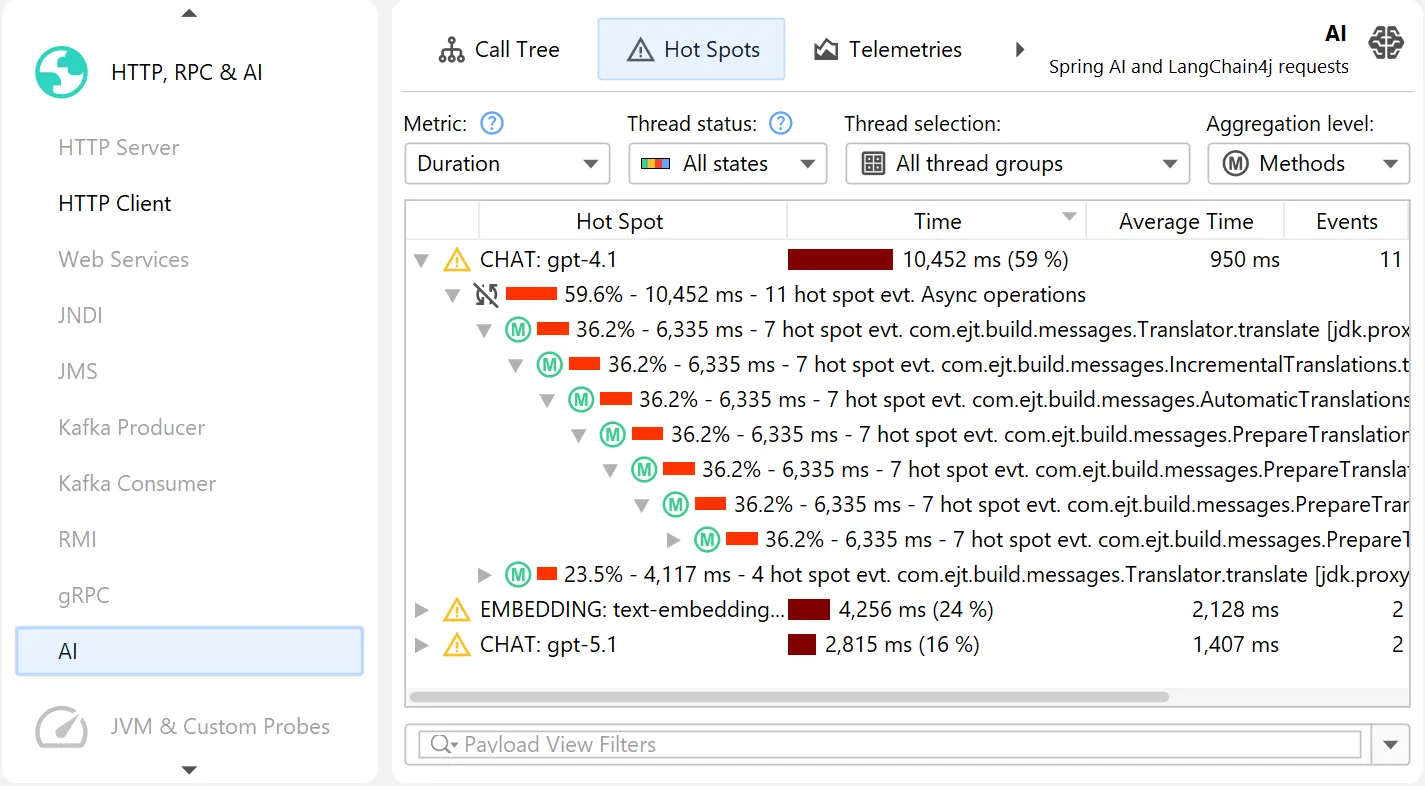
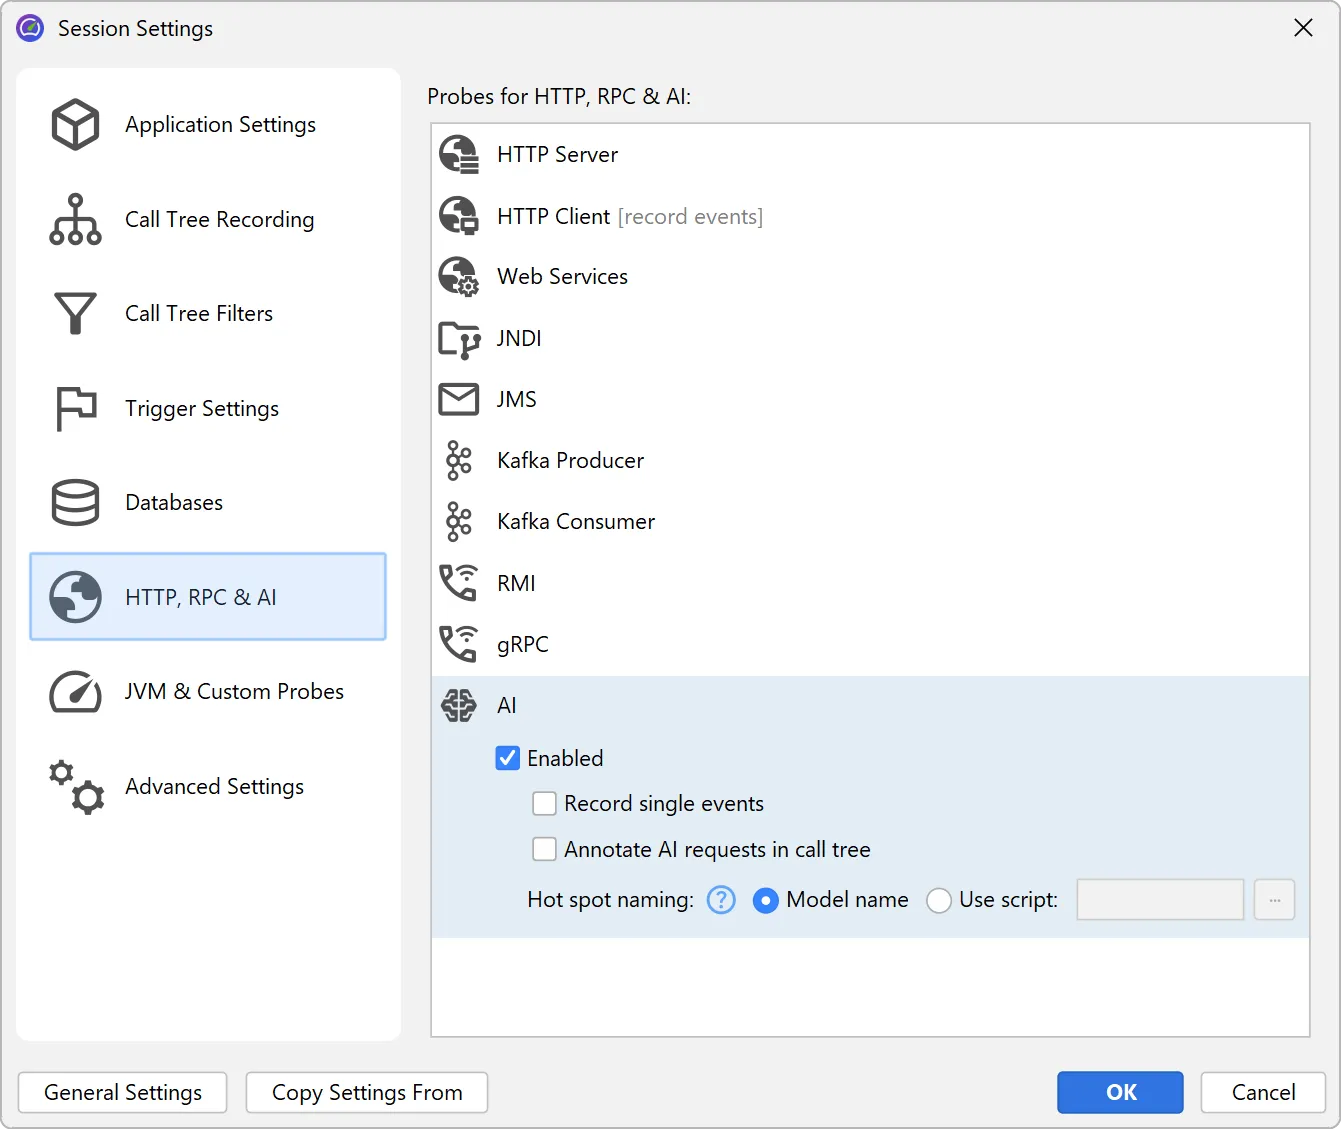
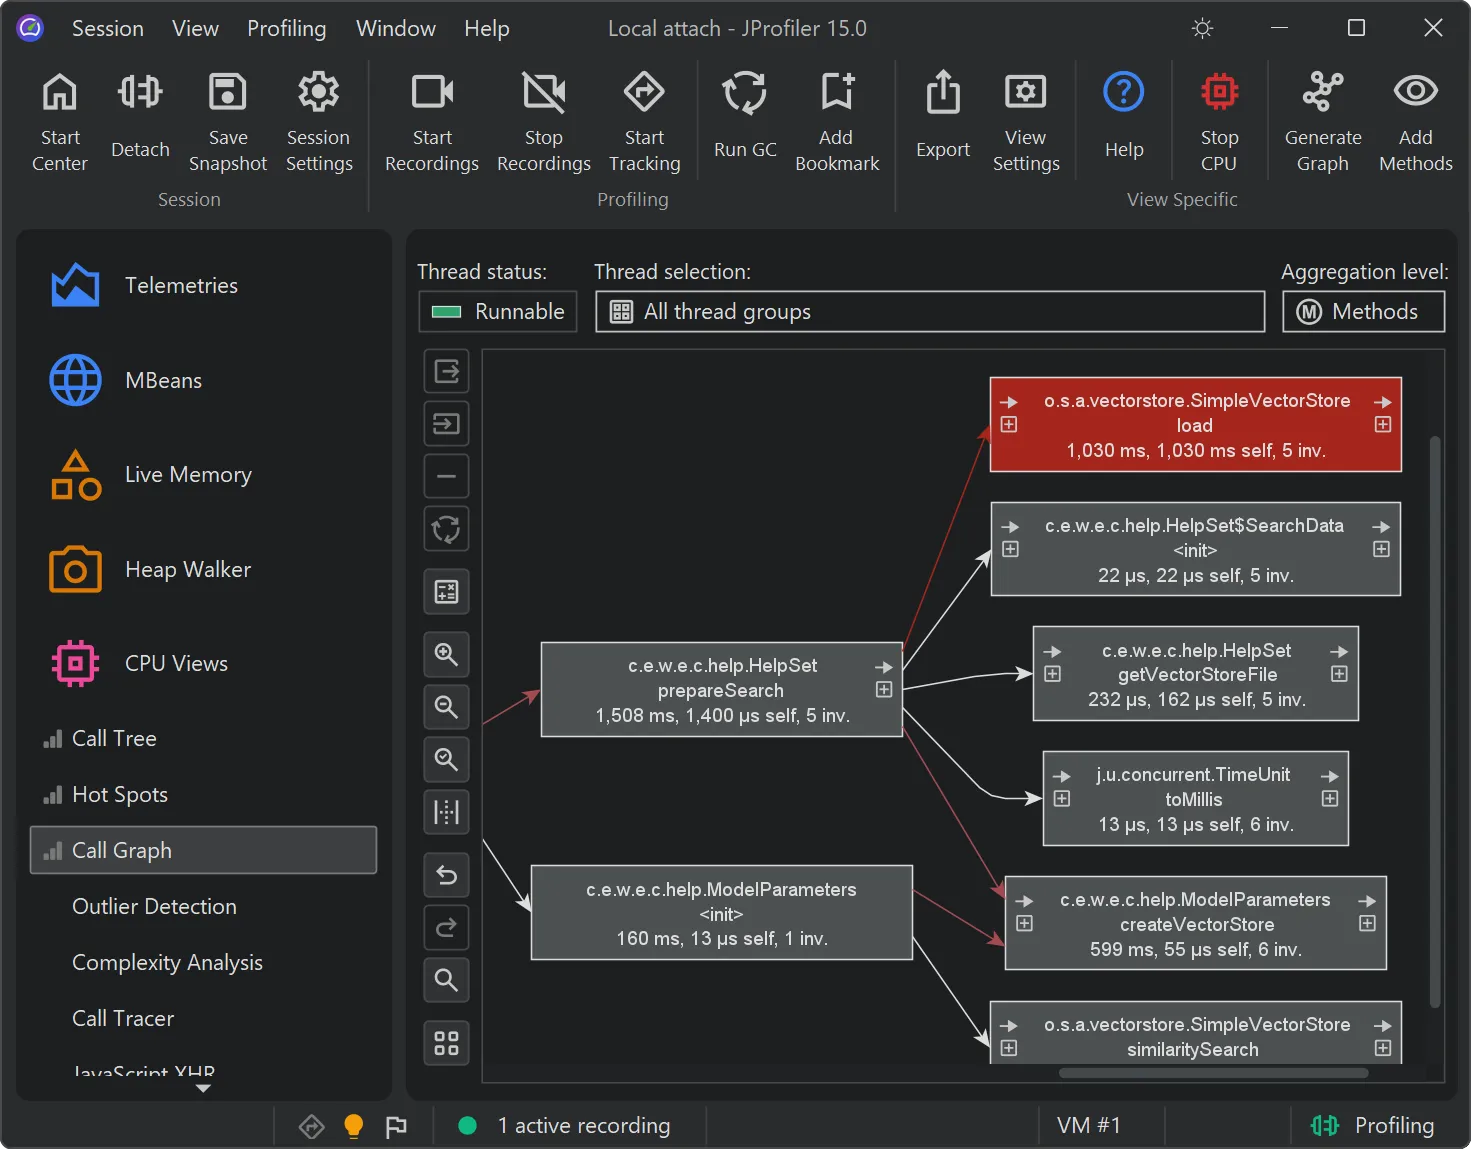
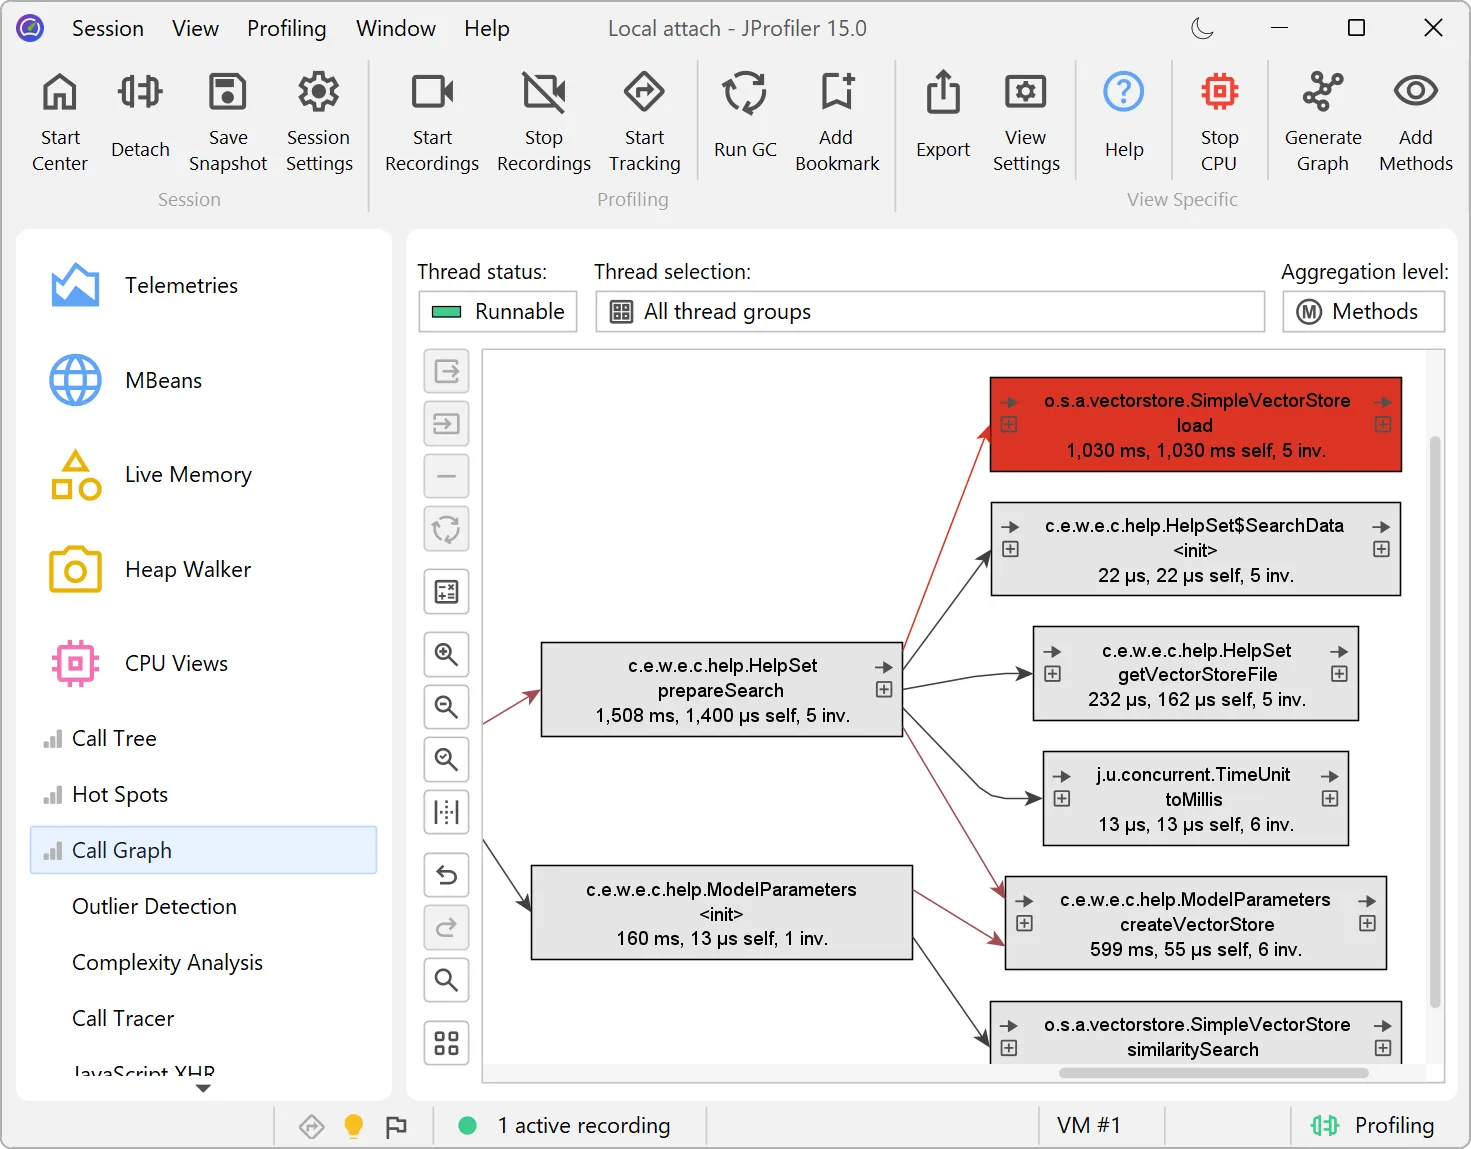
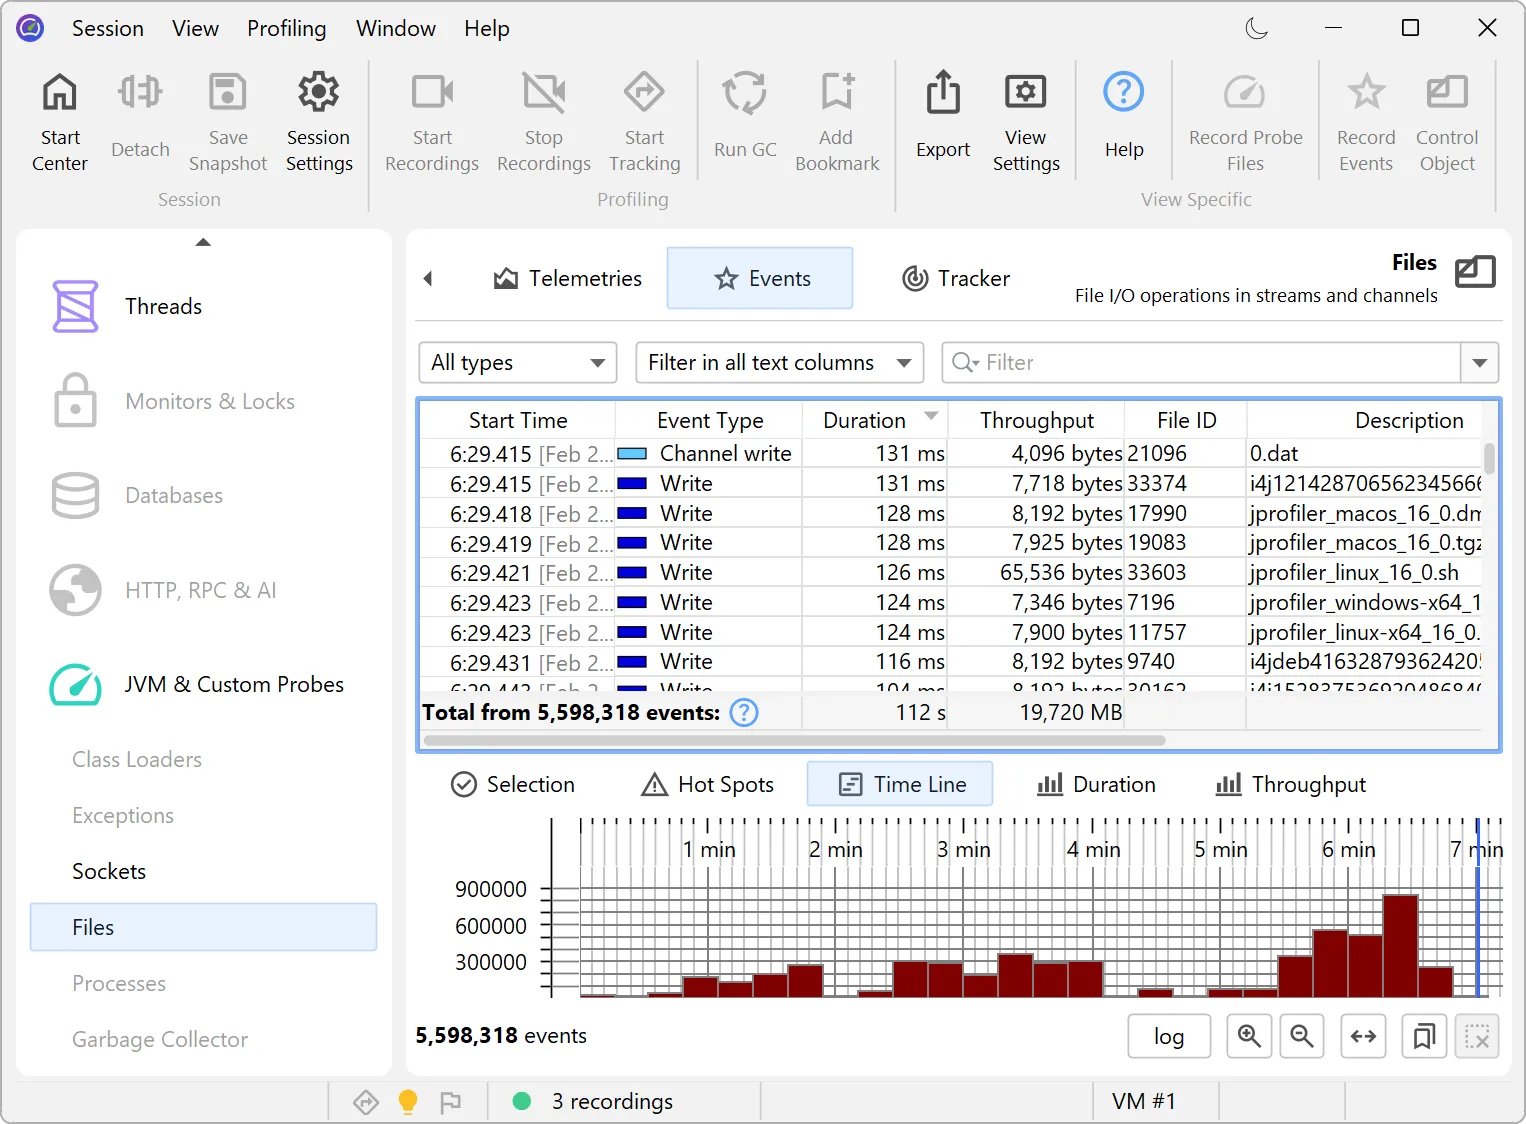
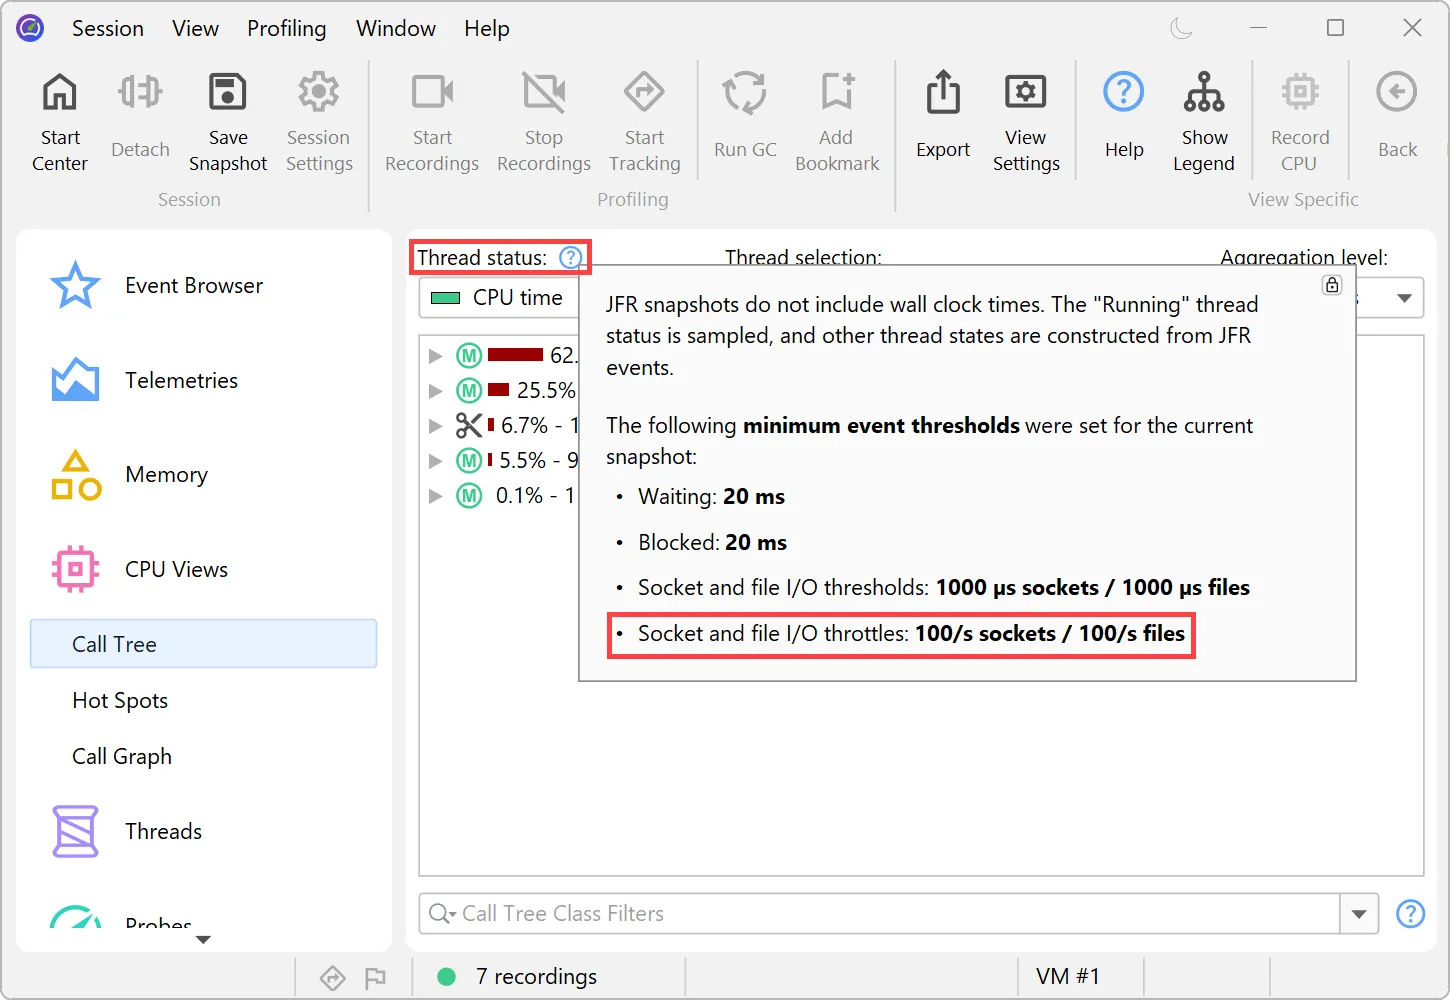
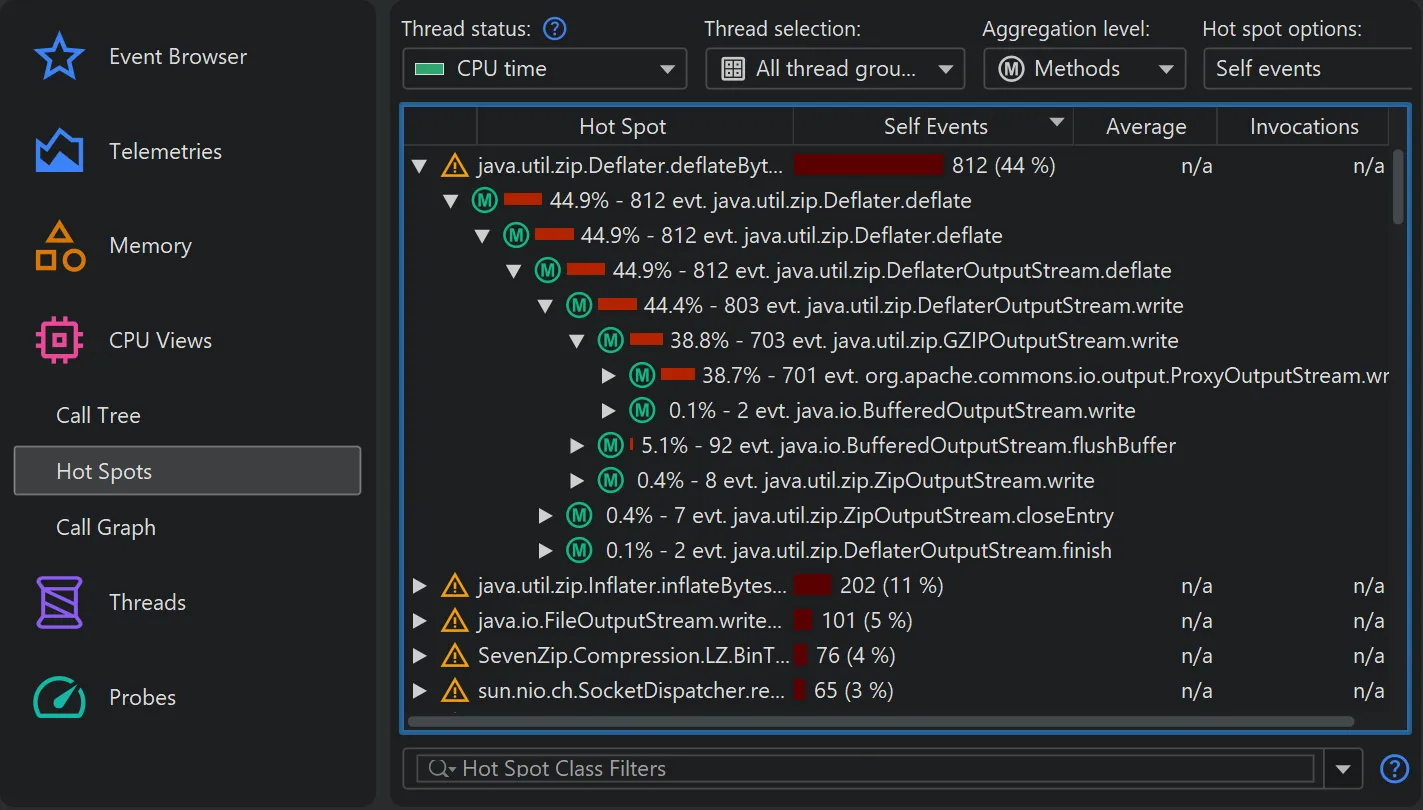
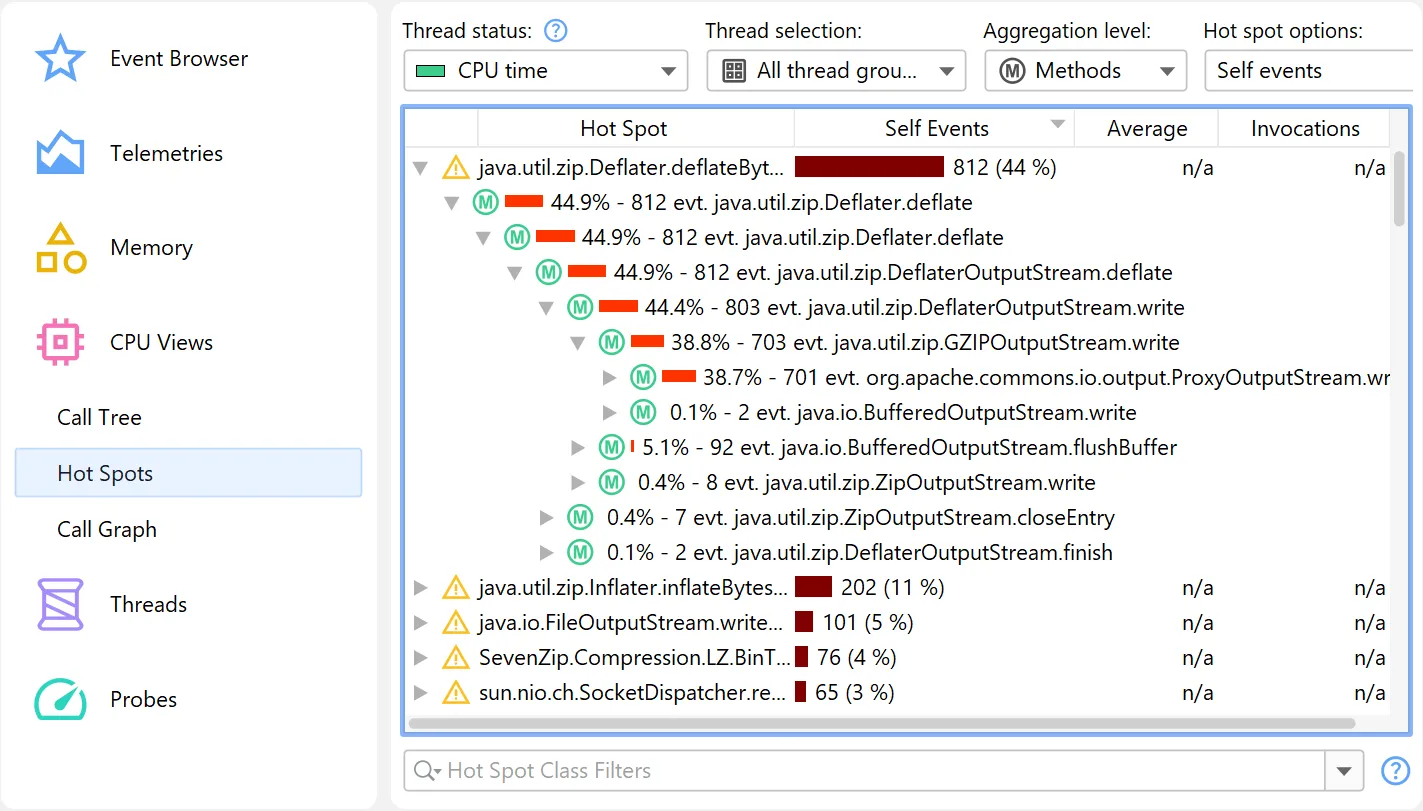
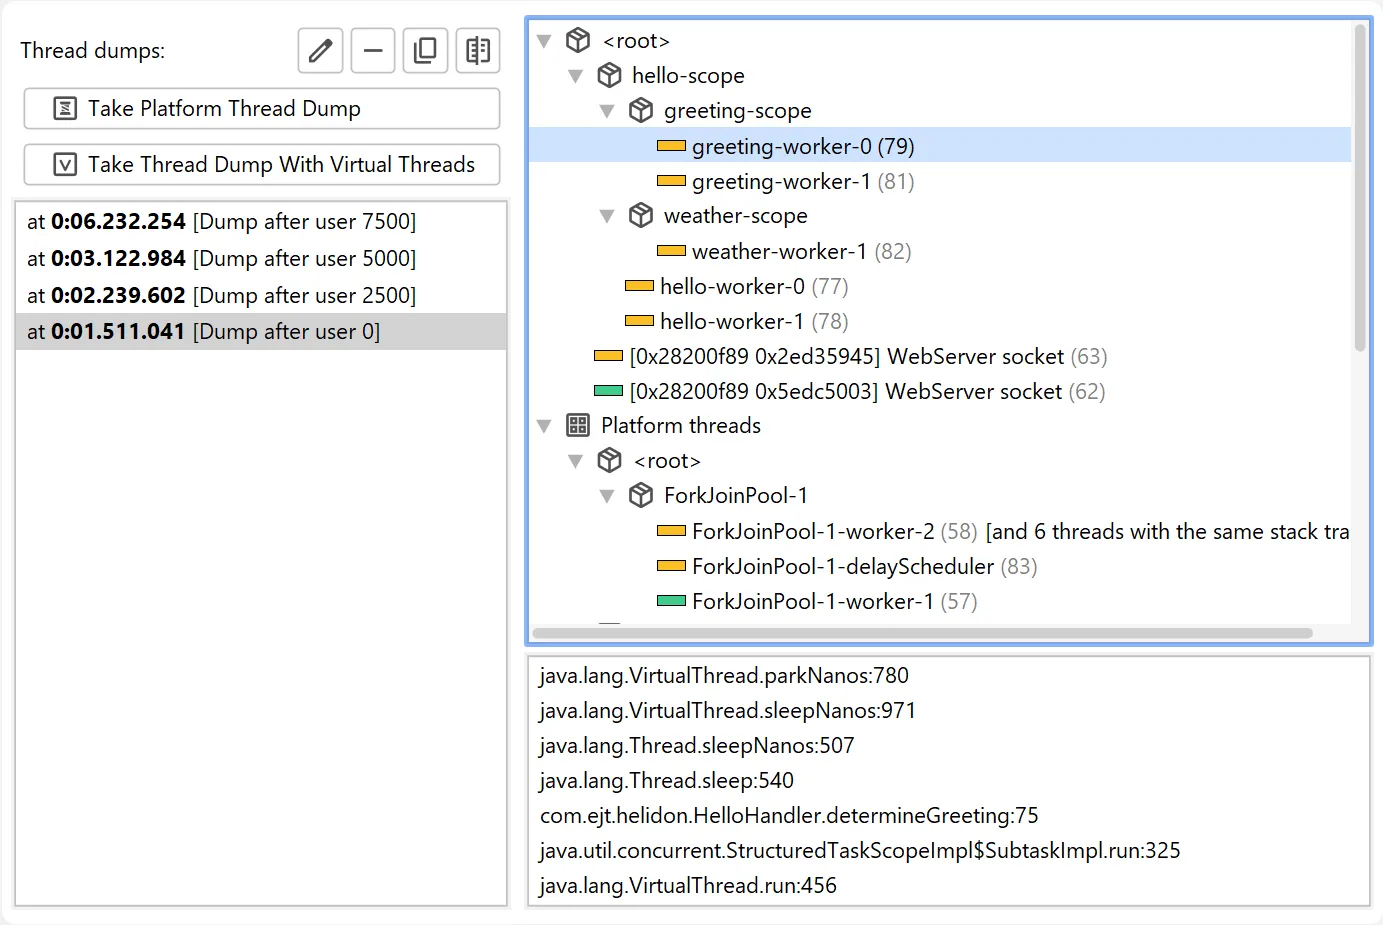
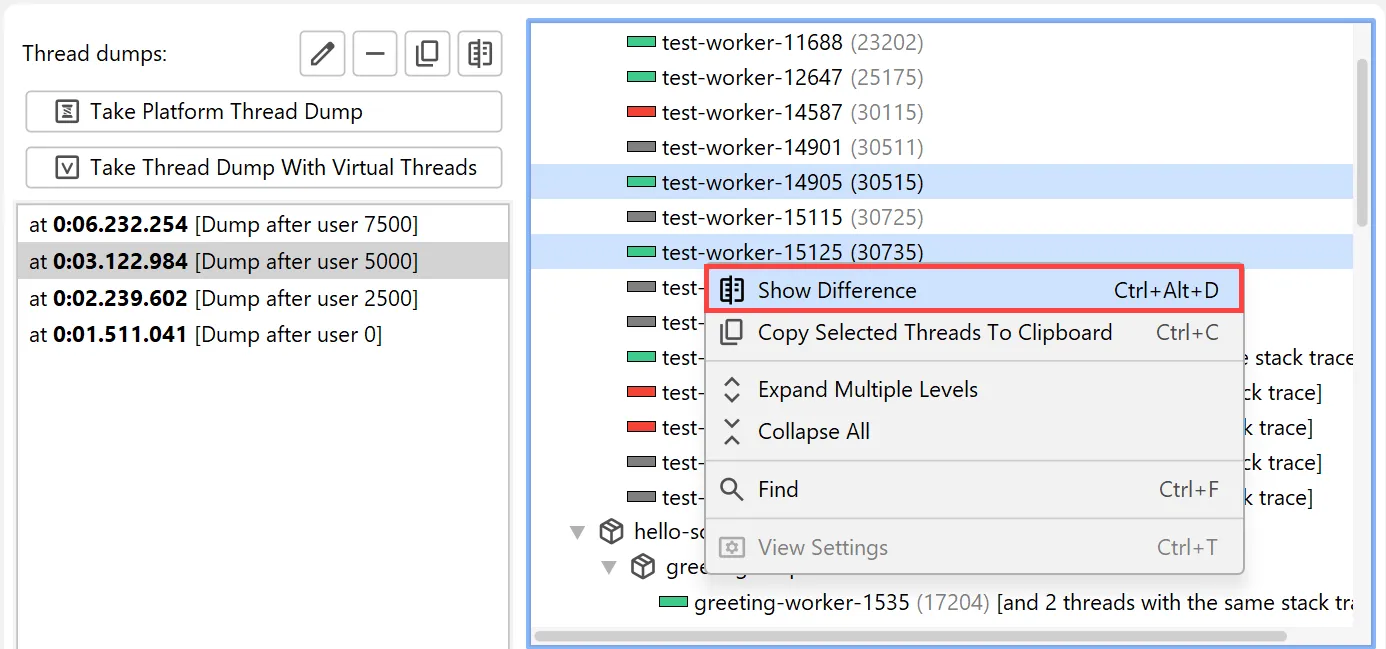
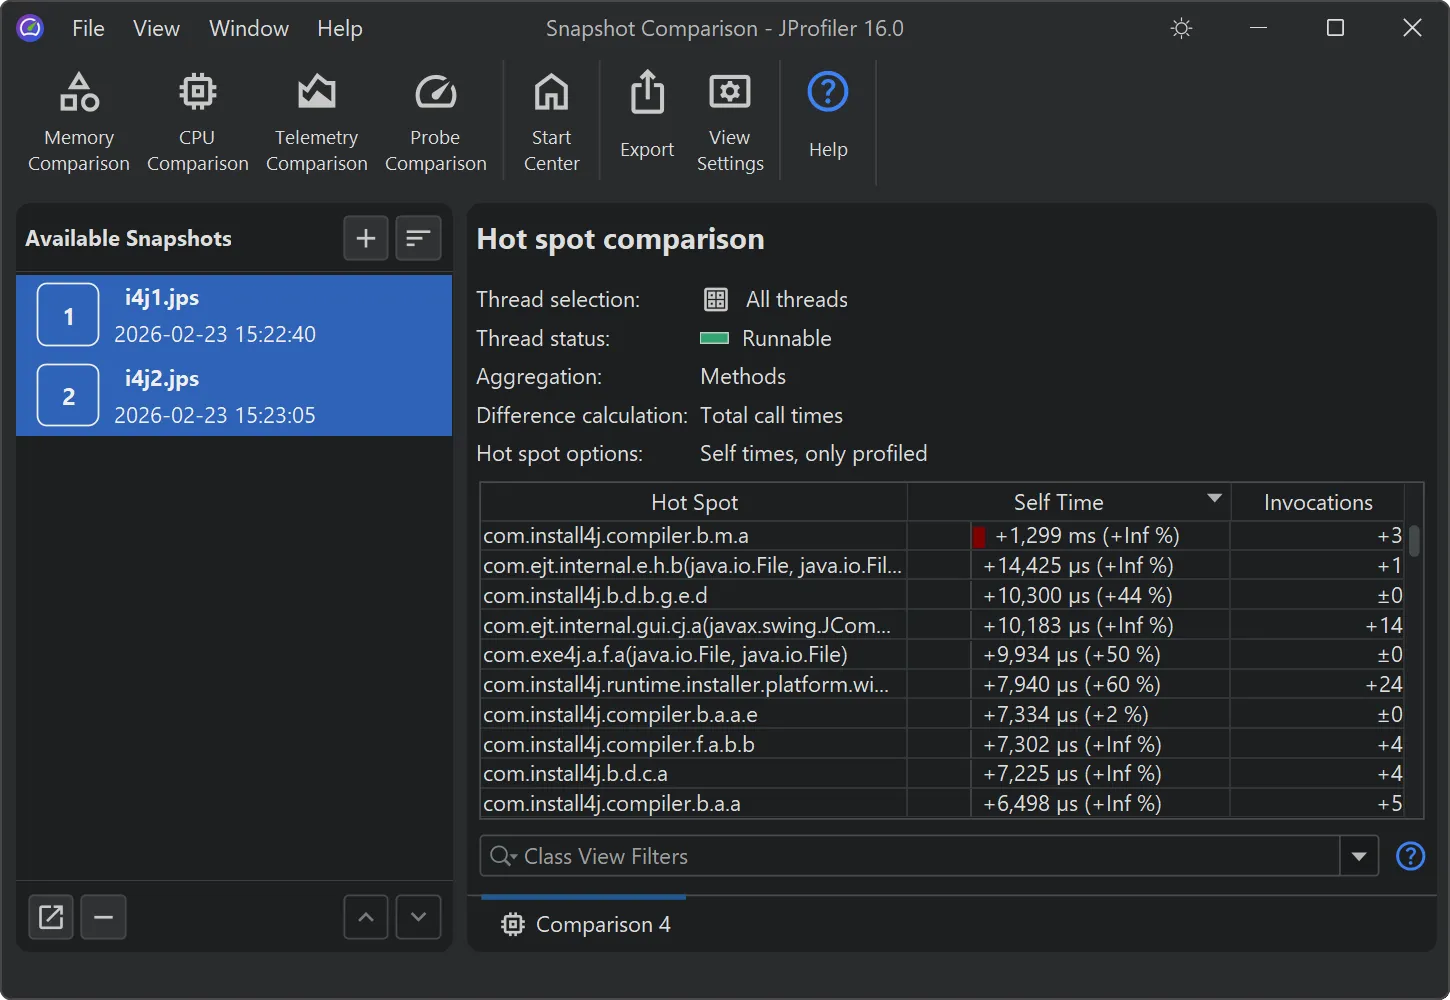
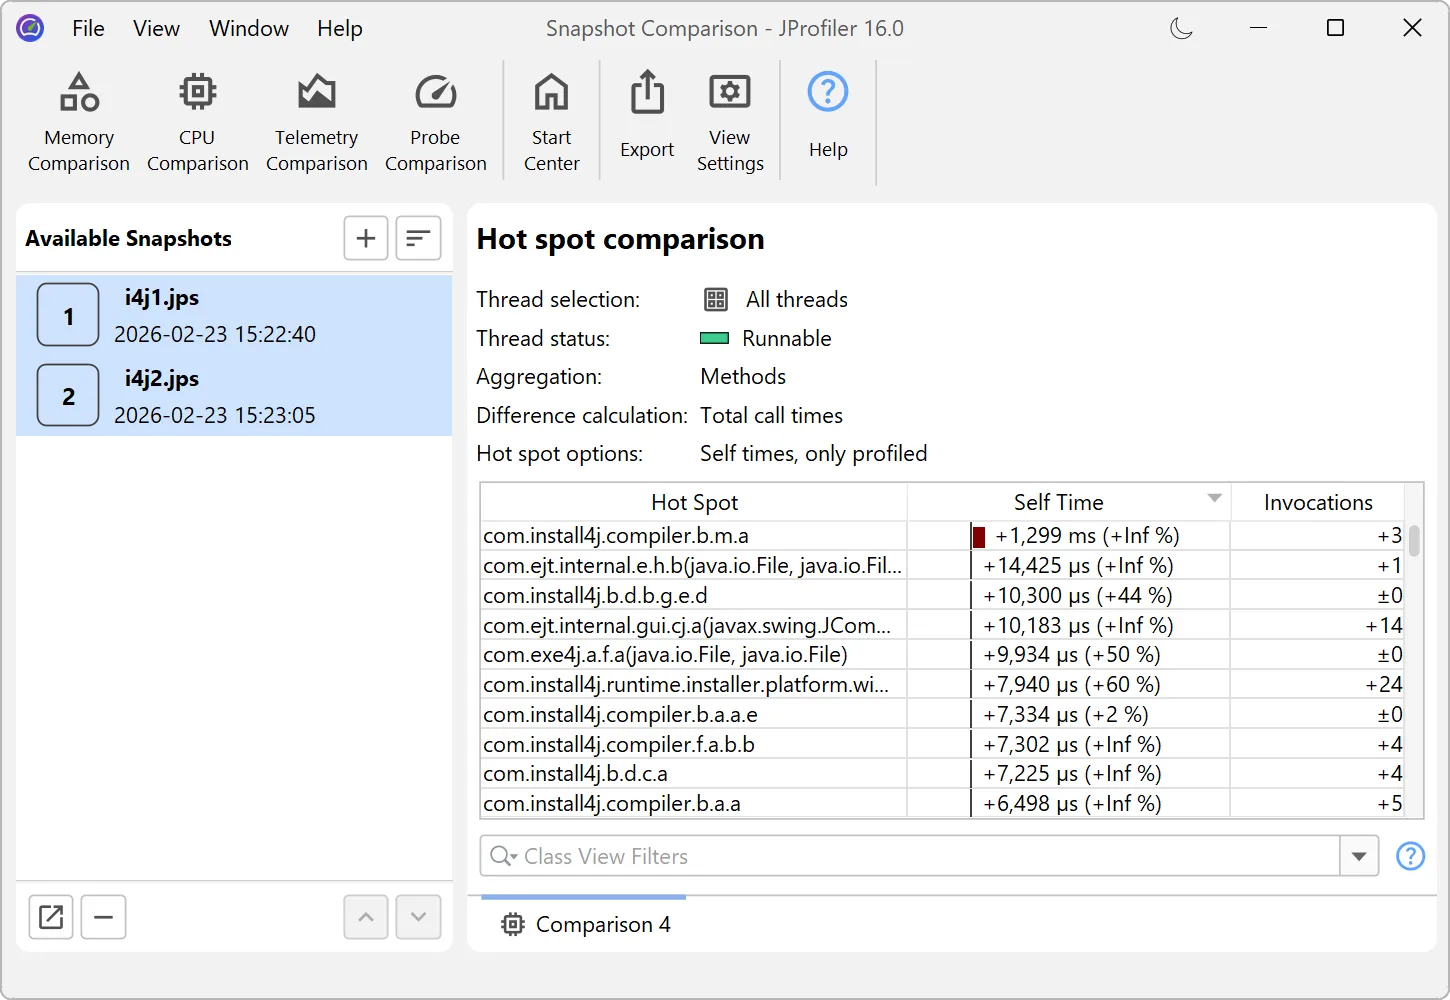
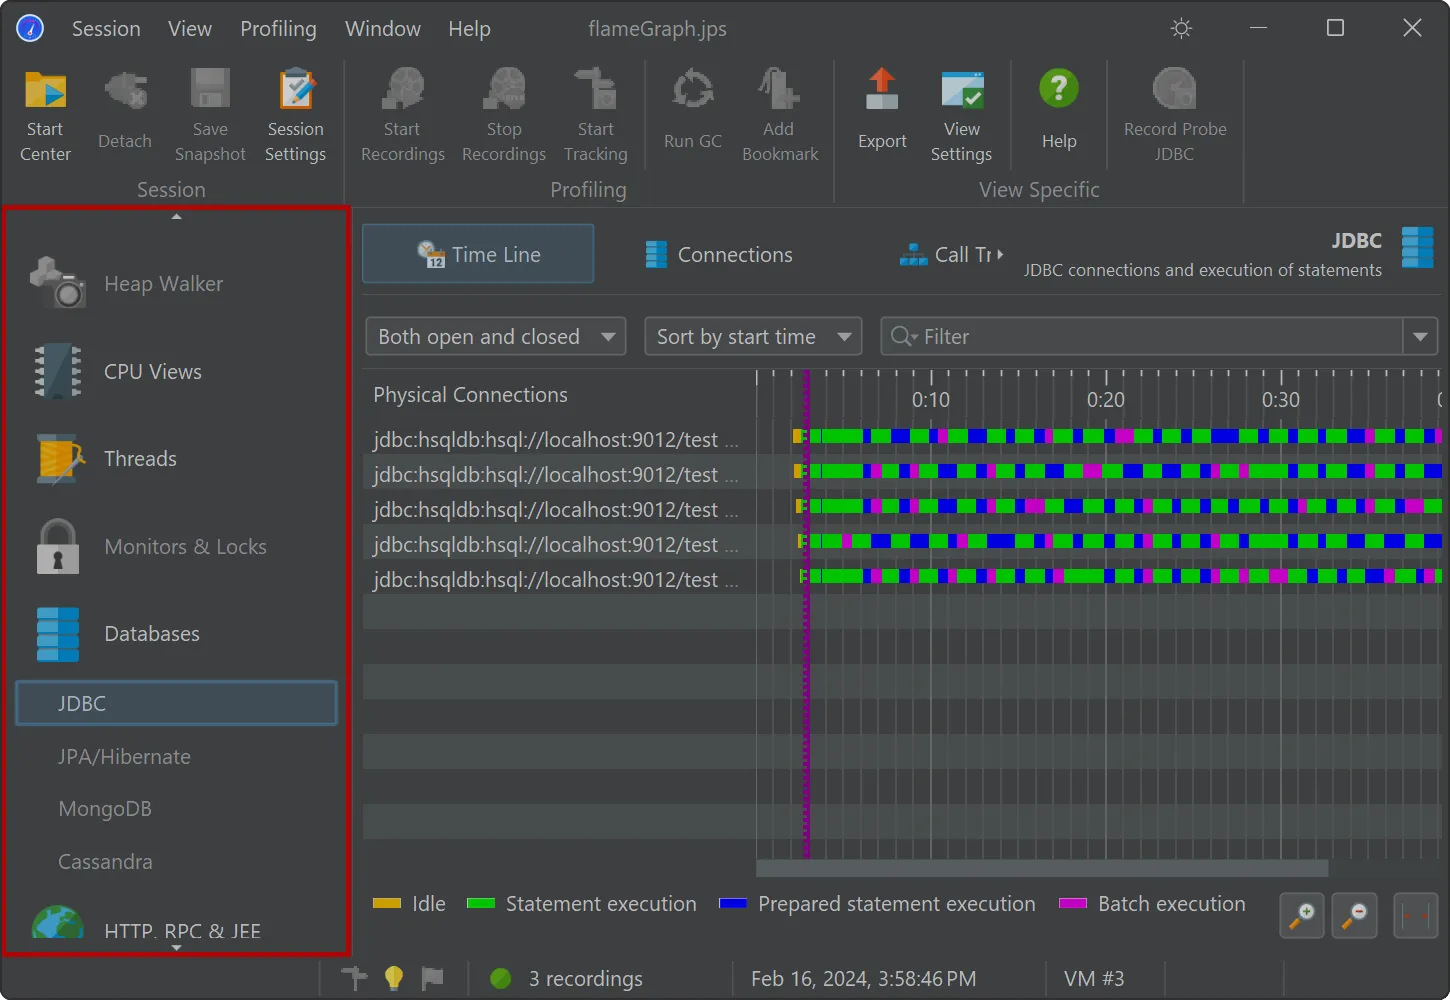
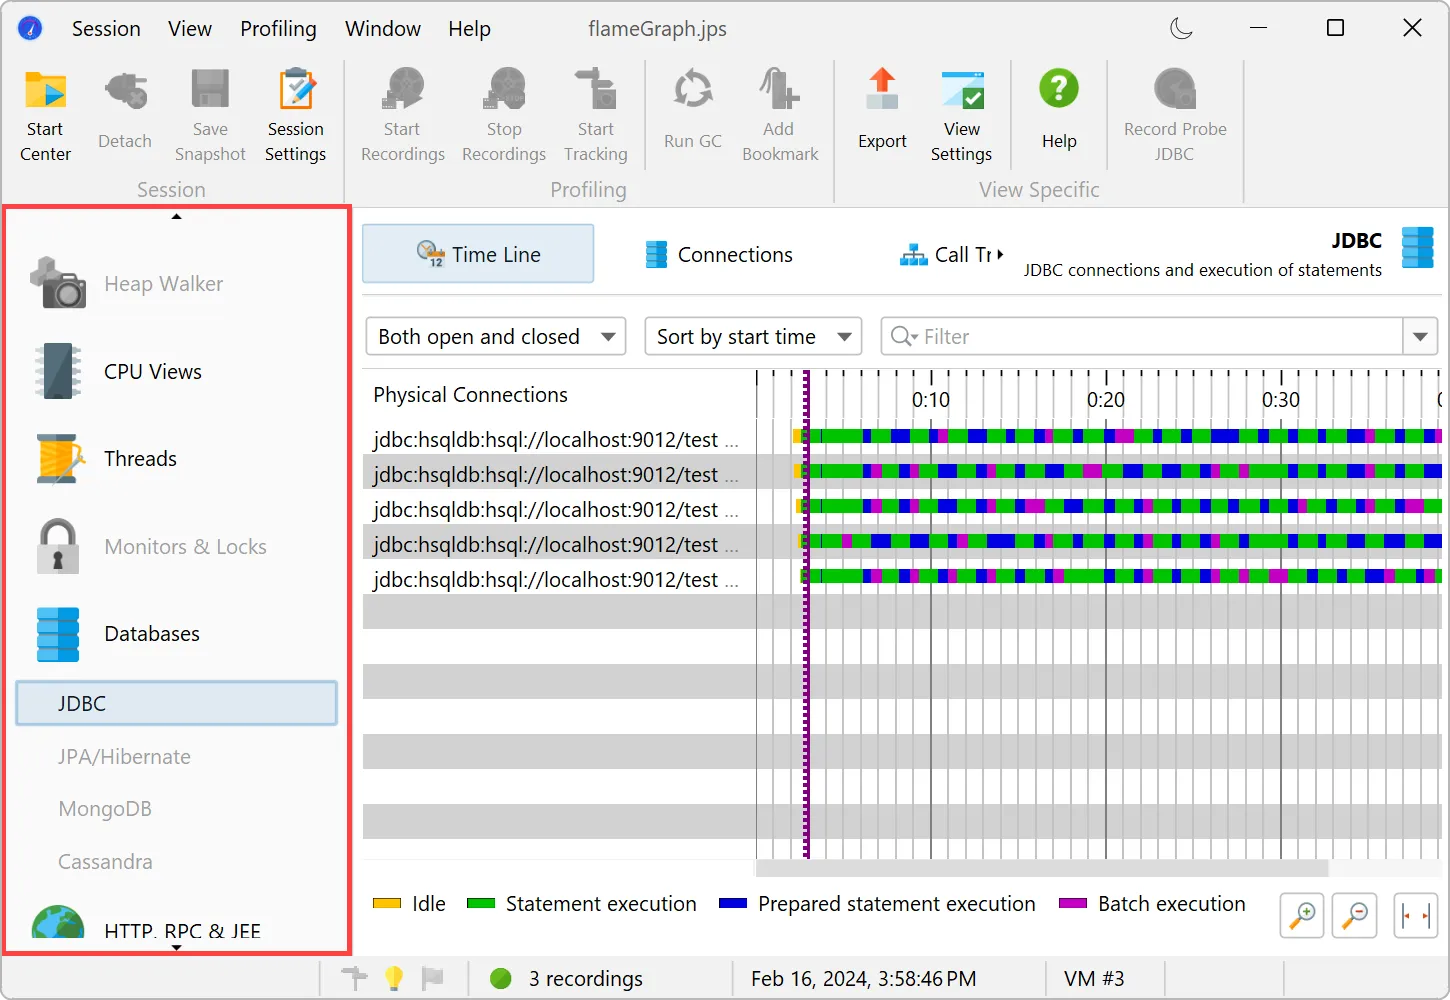
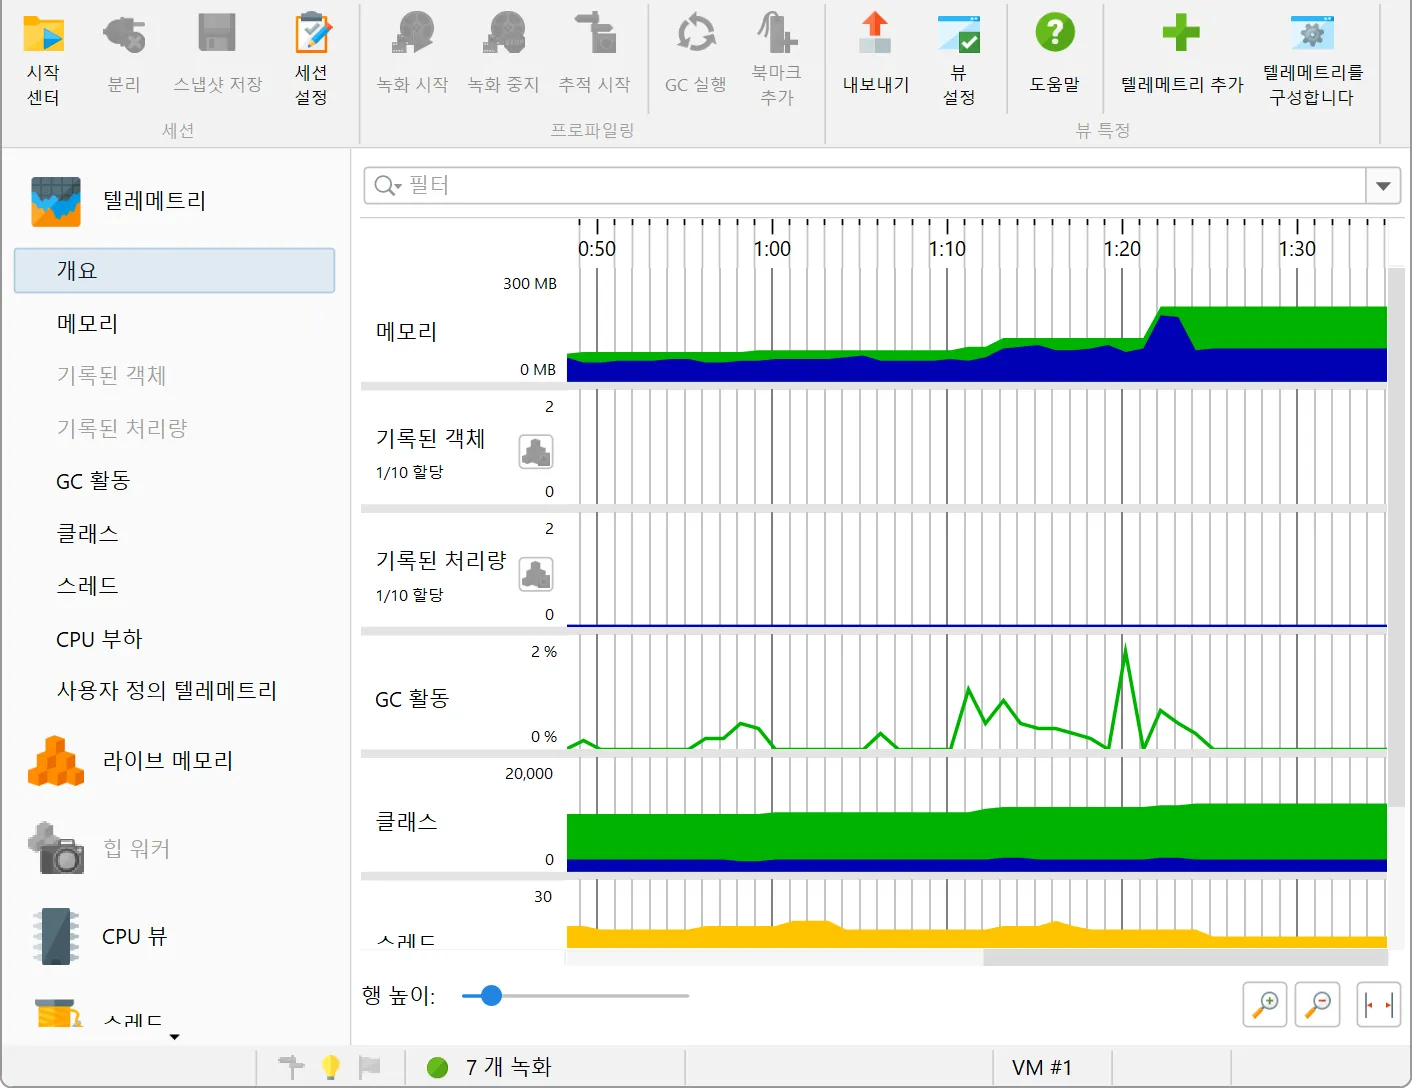
JProfiler has a new UI with a modern visual appearance and new icons. We hope you like it! We have light and dark themes.
You can see screenshots of them by toggling the dark mode switch at the top of this page.
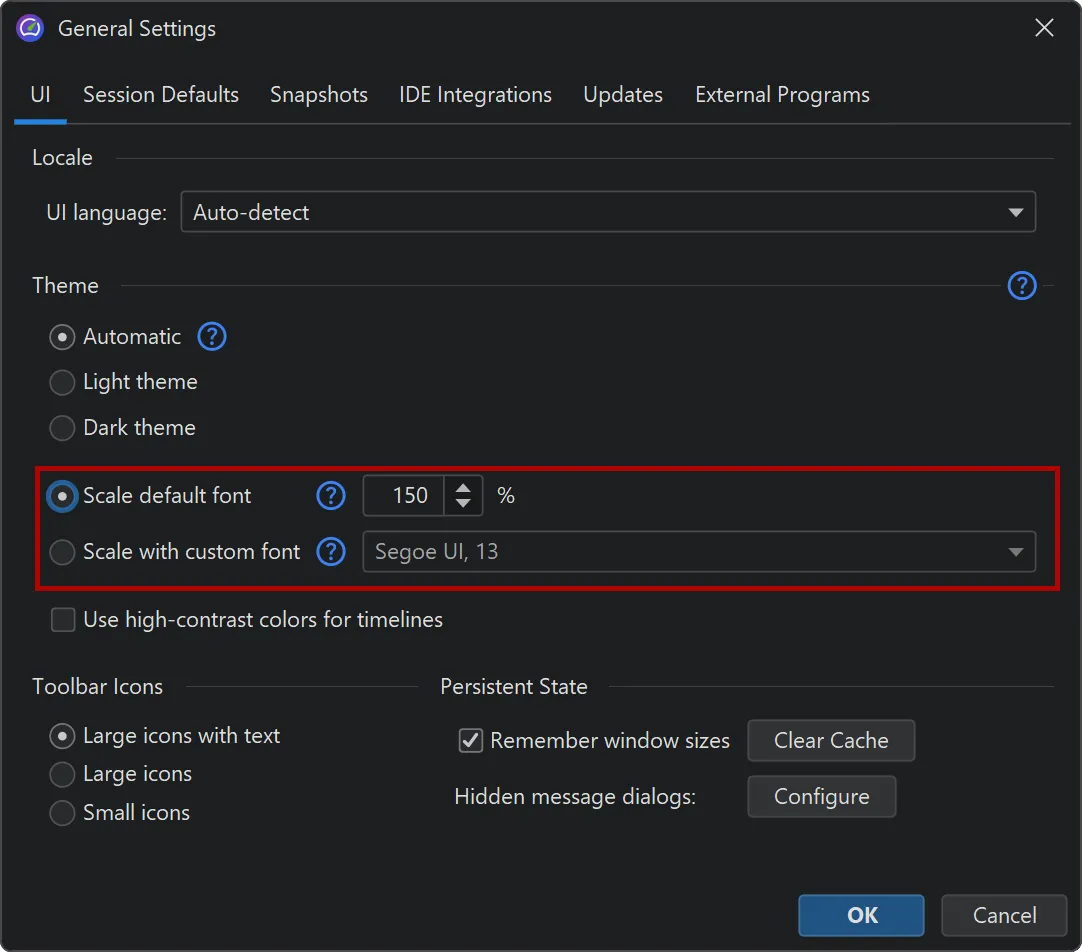
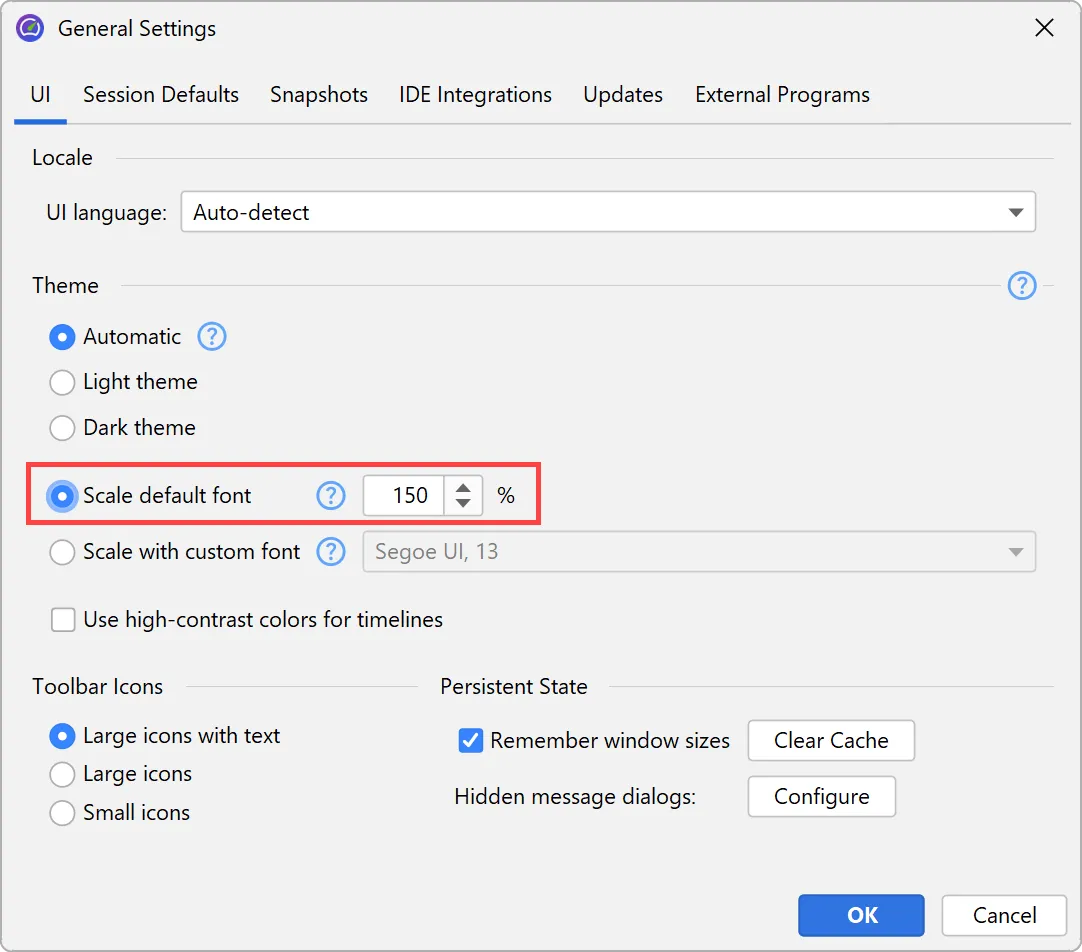
In addition, the UI is now fully scalable. In the general settings, you can either set a scale factor as a percentage, or set a
custom UI font with an arbitrary size, and the UI will be scaled accordingly.
This capability now allows the JProfiler UI to run on Linux with all OpenJDK variants and for all HiDPI resolutions. Previously, only
the JetBrains runtime was supported on Linux with HiDPI resolutions.
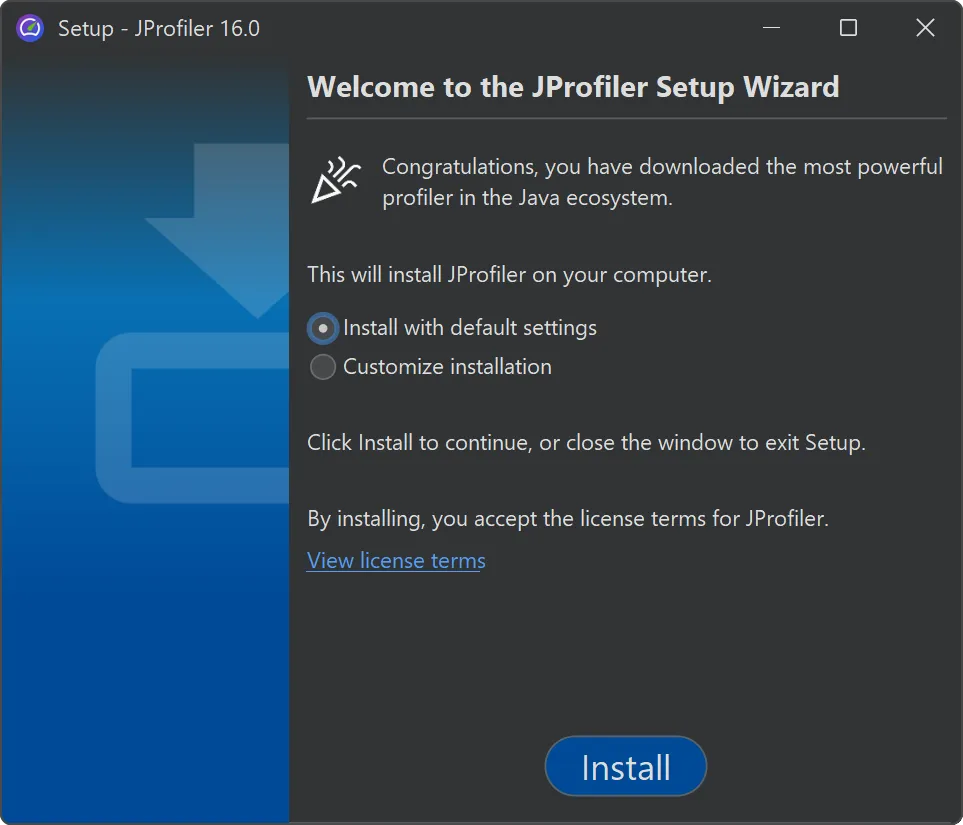
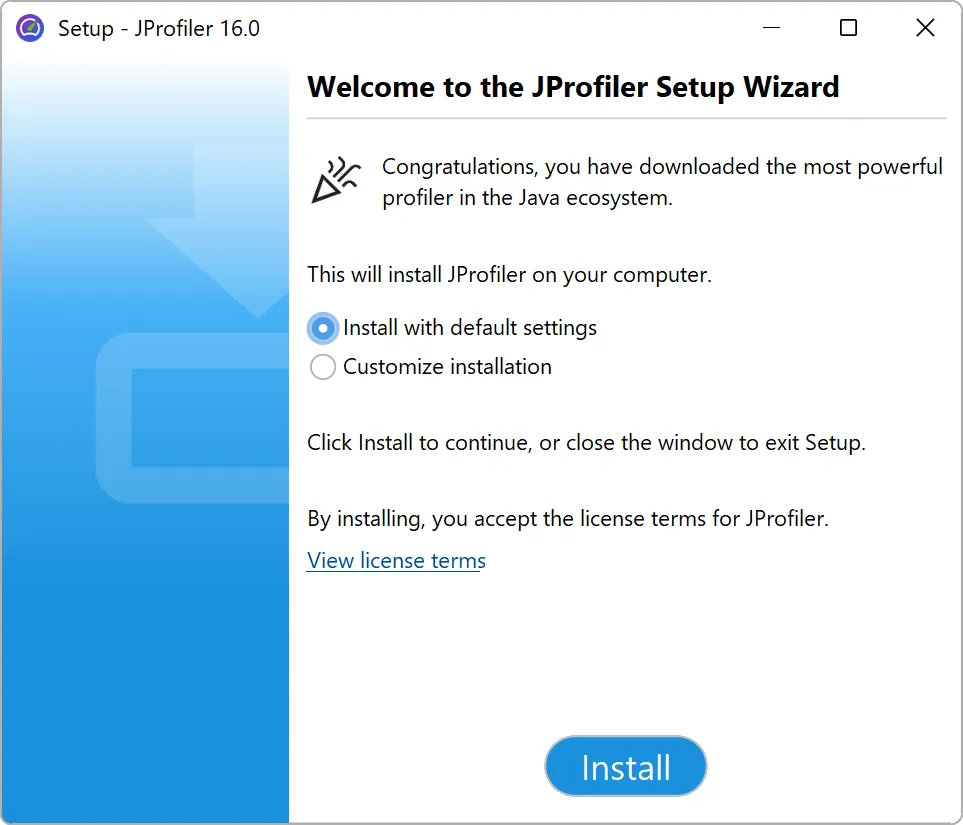
The JProfiler installer has been modernized, and its default execution mode has been streamlined. By default, no admin privileges are requested
unless you choose to install for all users in its customized execution mode.
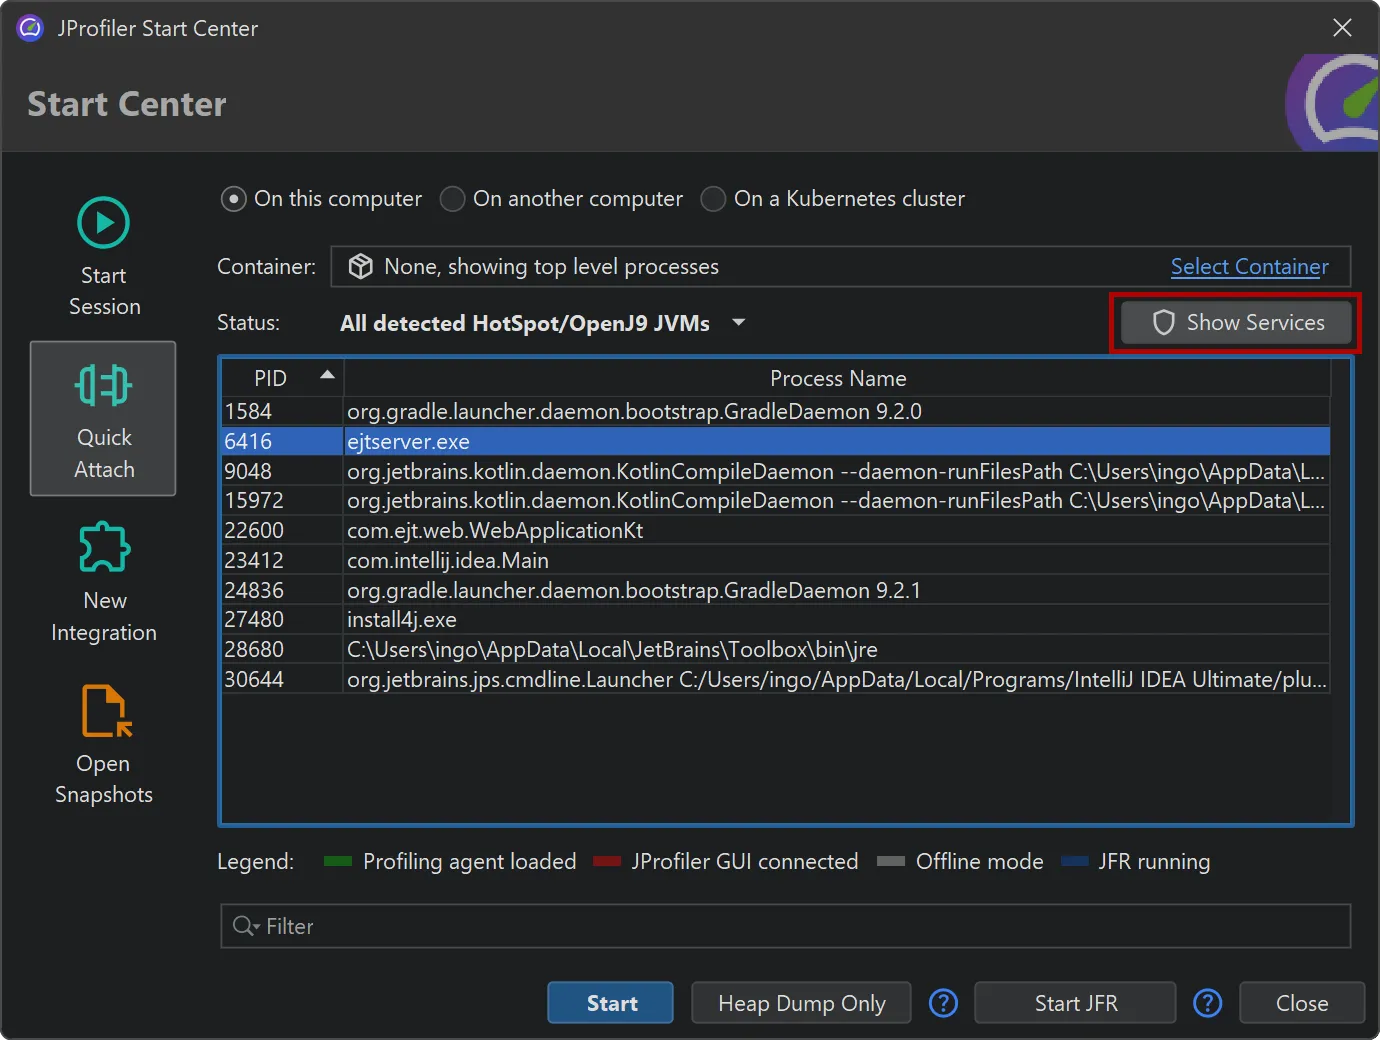
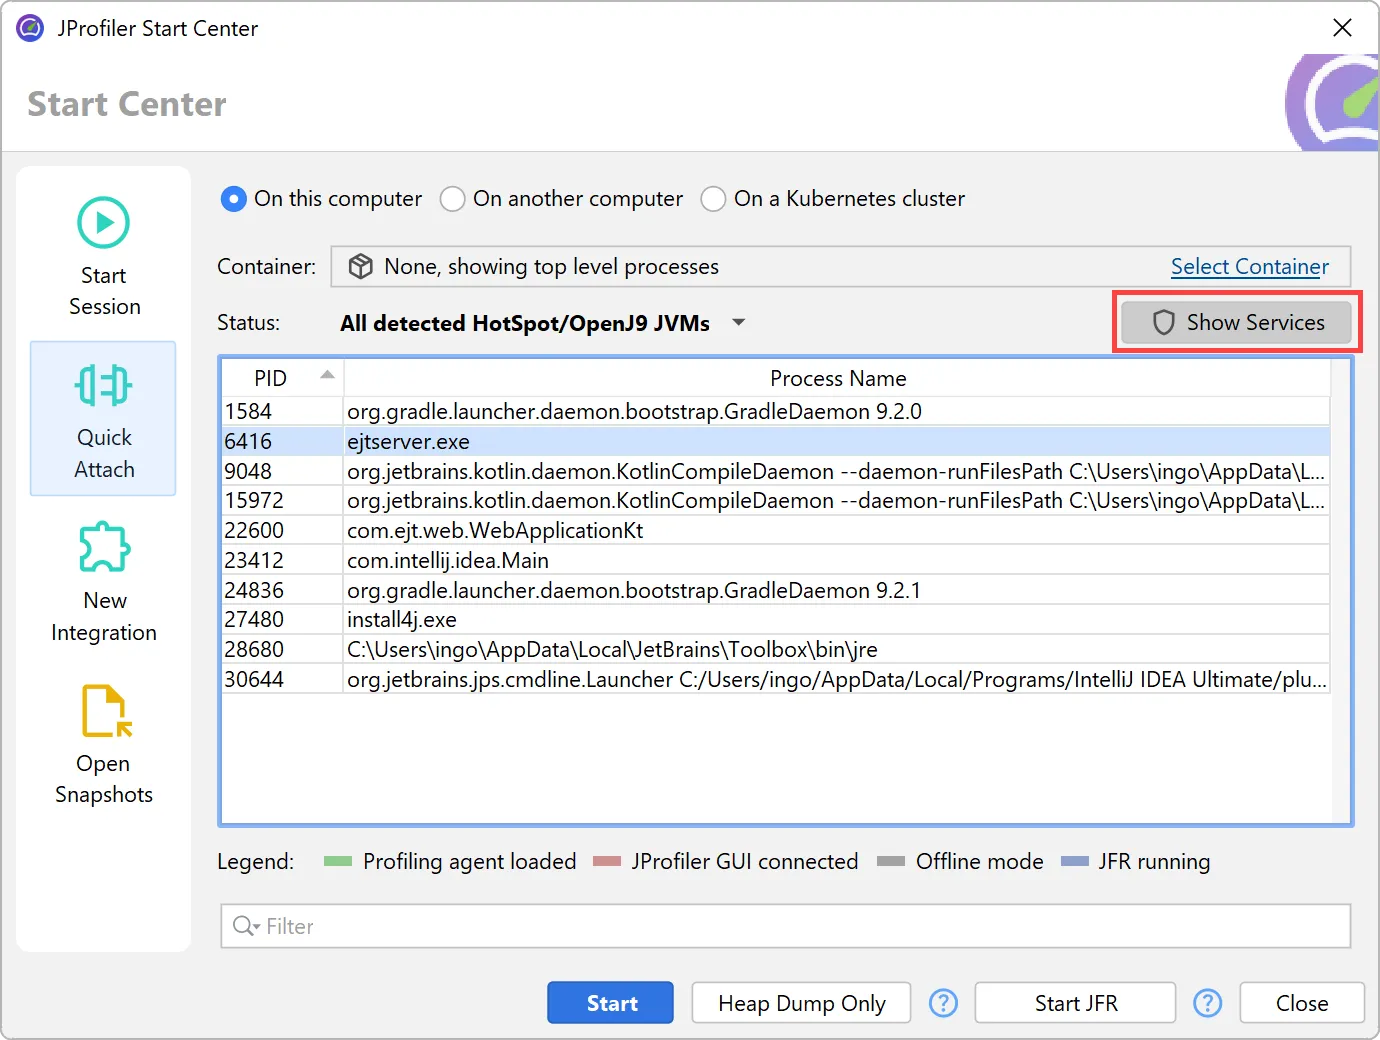
As a related enhancement, it is now possible to attach to Windows processes running as other users, even if JProfiler is not installed
in a directory that is readable by those processes. This is especially important for attaching to Windows services.
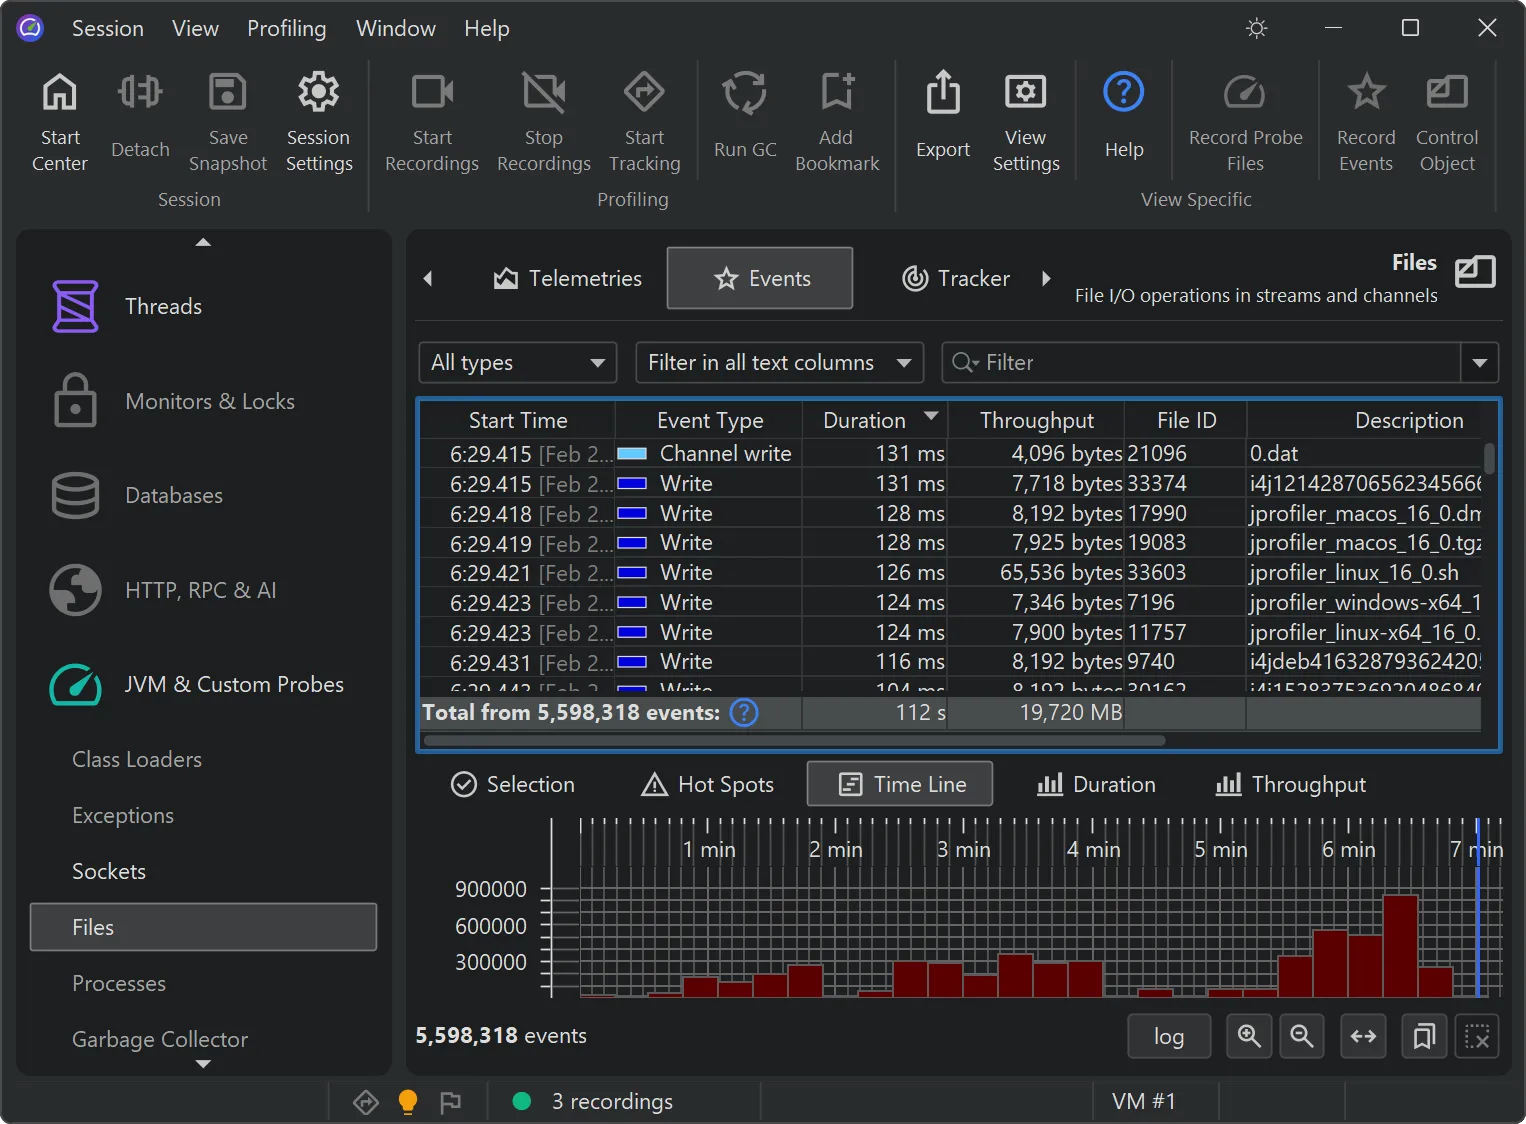
JProfiler's probe event recording has been reimplemented. This brings scalability to many millions of events and many new features.
When probes were introduced in JProfiler 7, the focus was on cumulative data, like hot spots and telemetries. Single events were available
as a tool for debugging problems, but they were all held in memory, so they were limited to relatively low event counts.
However, keeping all events enables advanced filtering that is impossible to achieve using aggregate data alone. The new file-based
backend supports high-throughput recording, enabling complex queries across massive event sets that were previously impossible to
process.
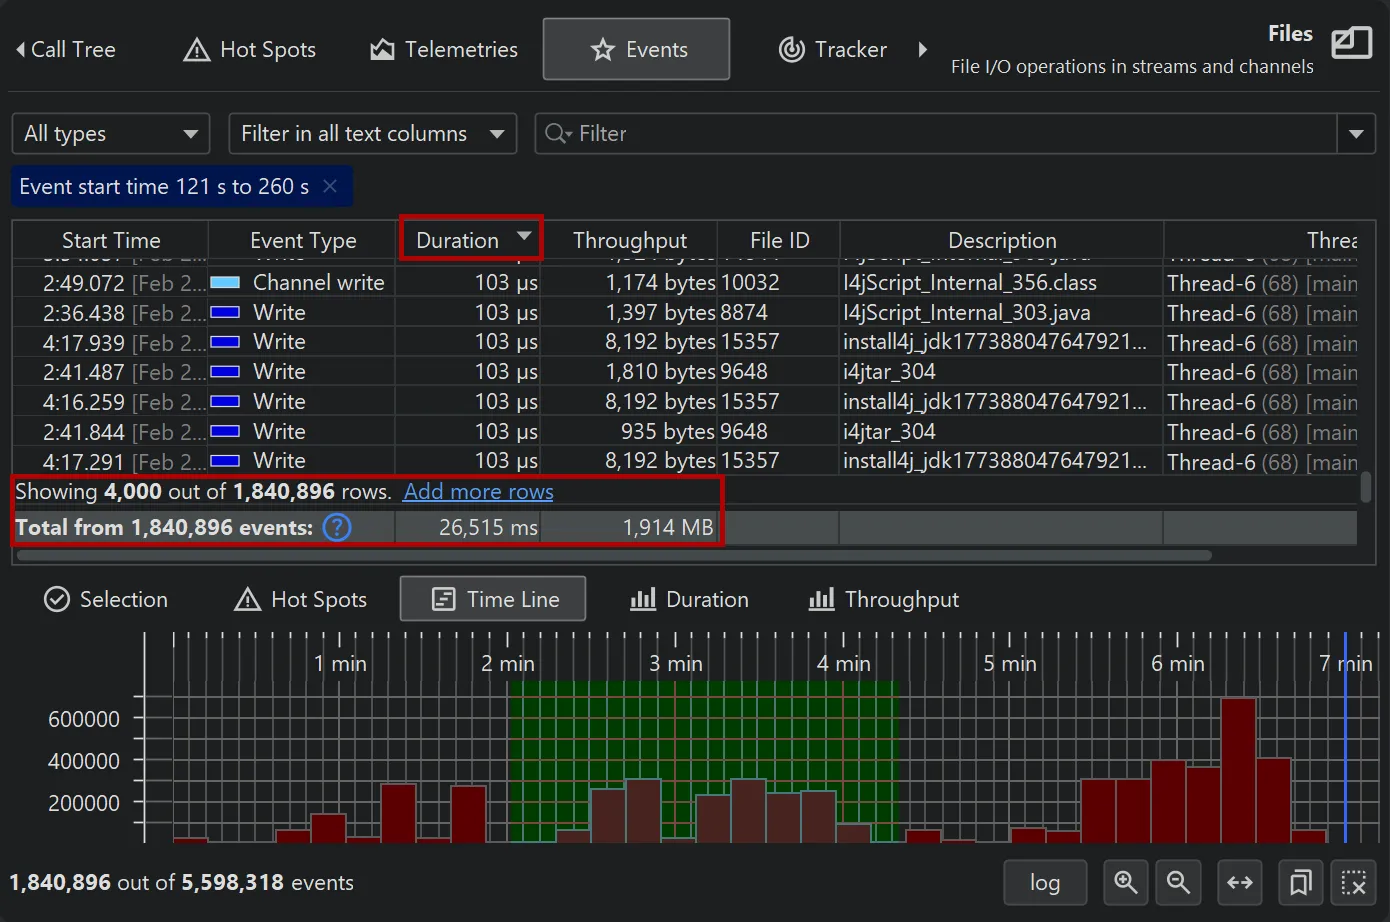
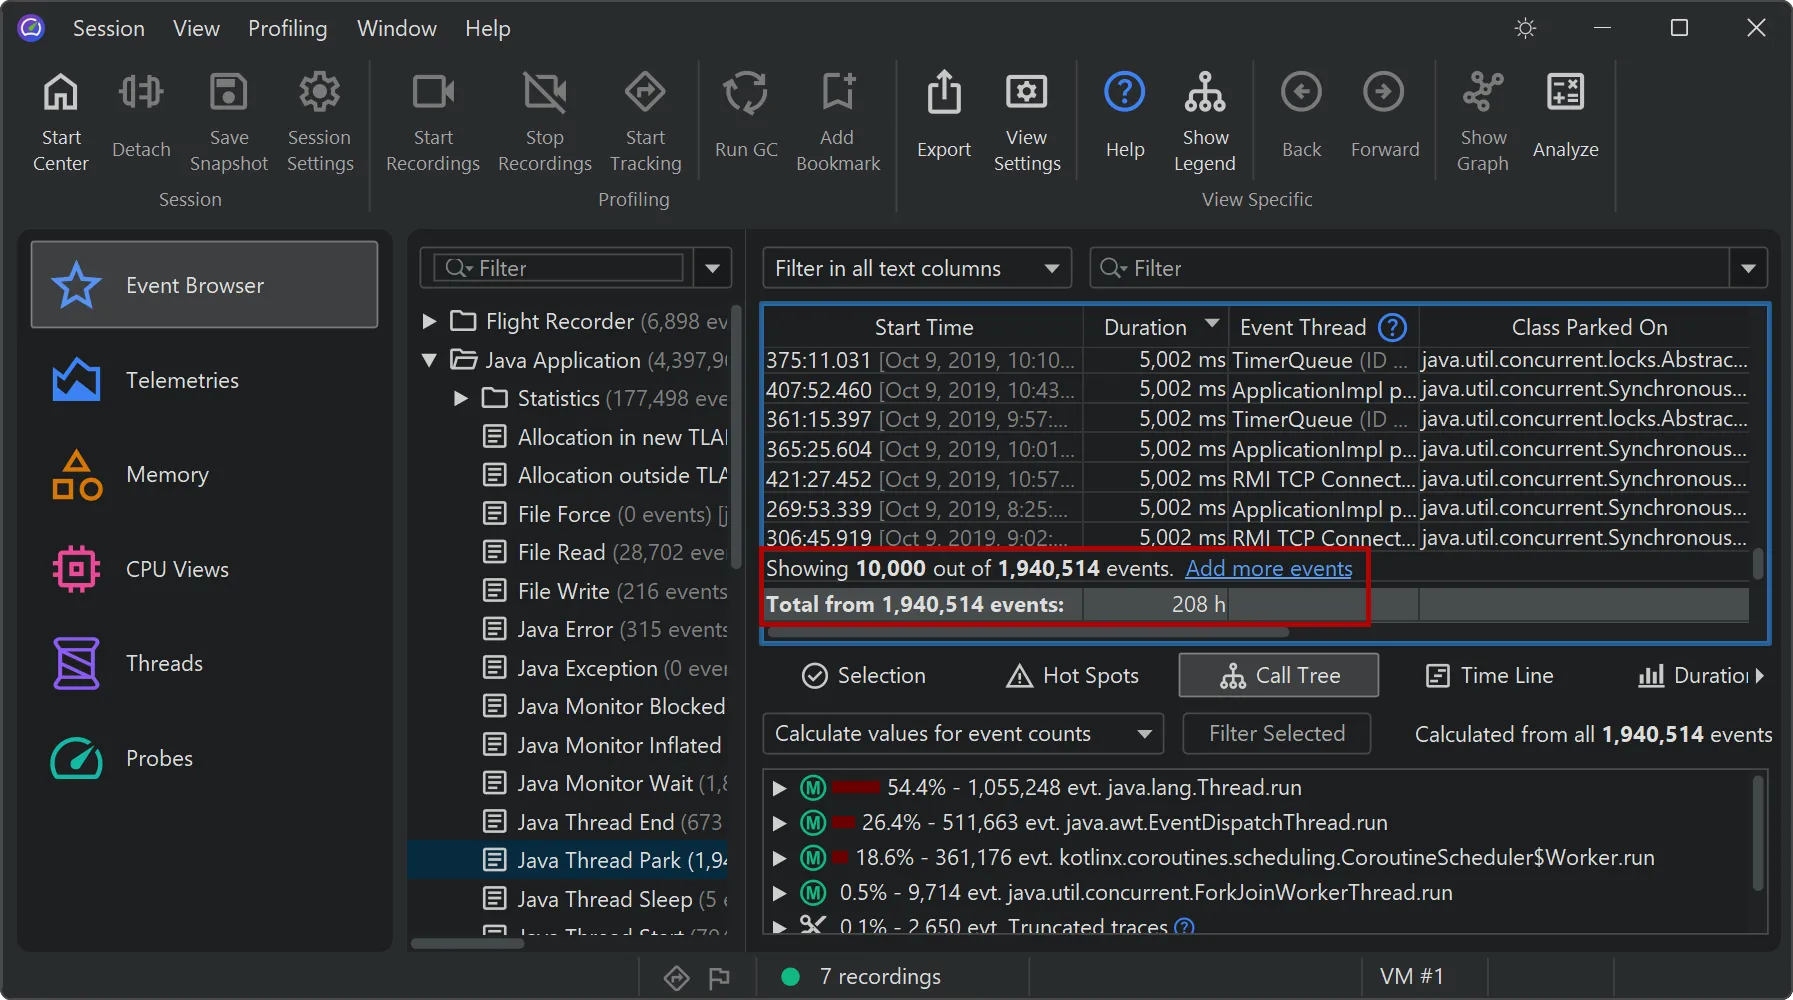
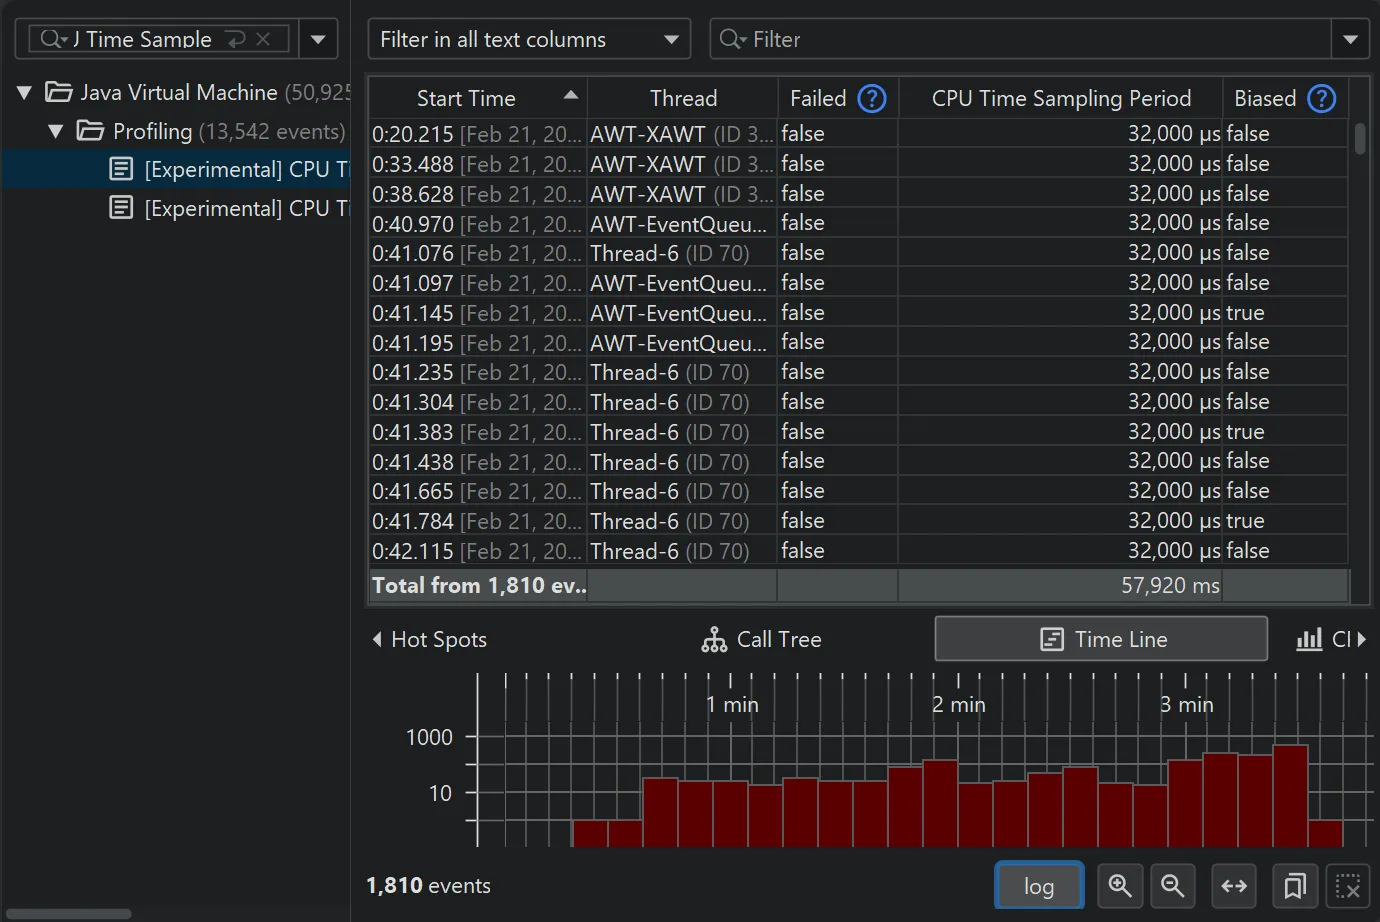
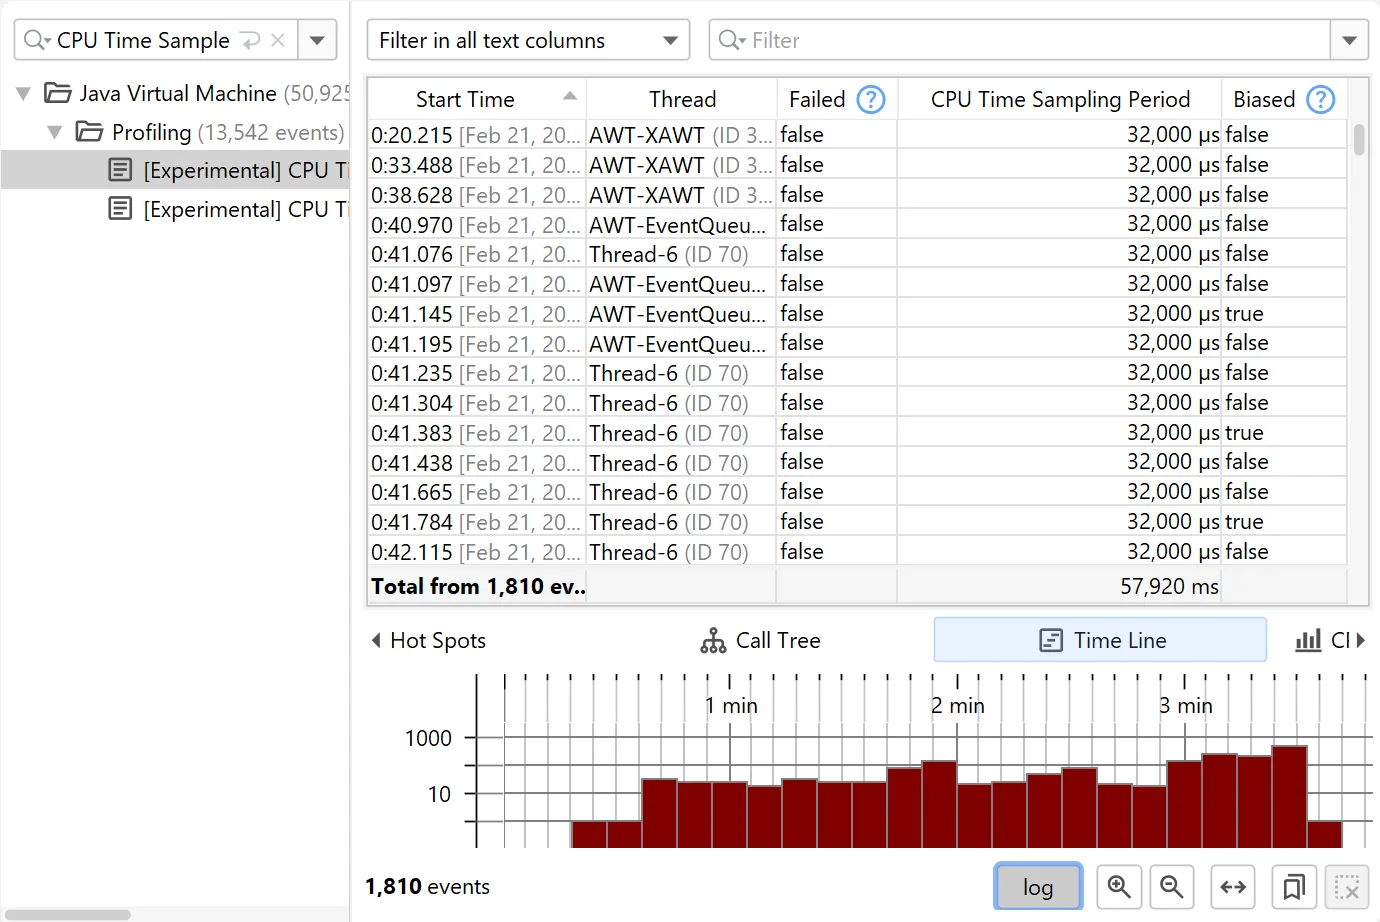
The new timeline tab at the bottom of the events view shows a histogram of all recorded events and allows you to select a time
range for filtering.
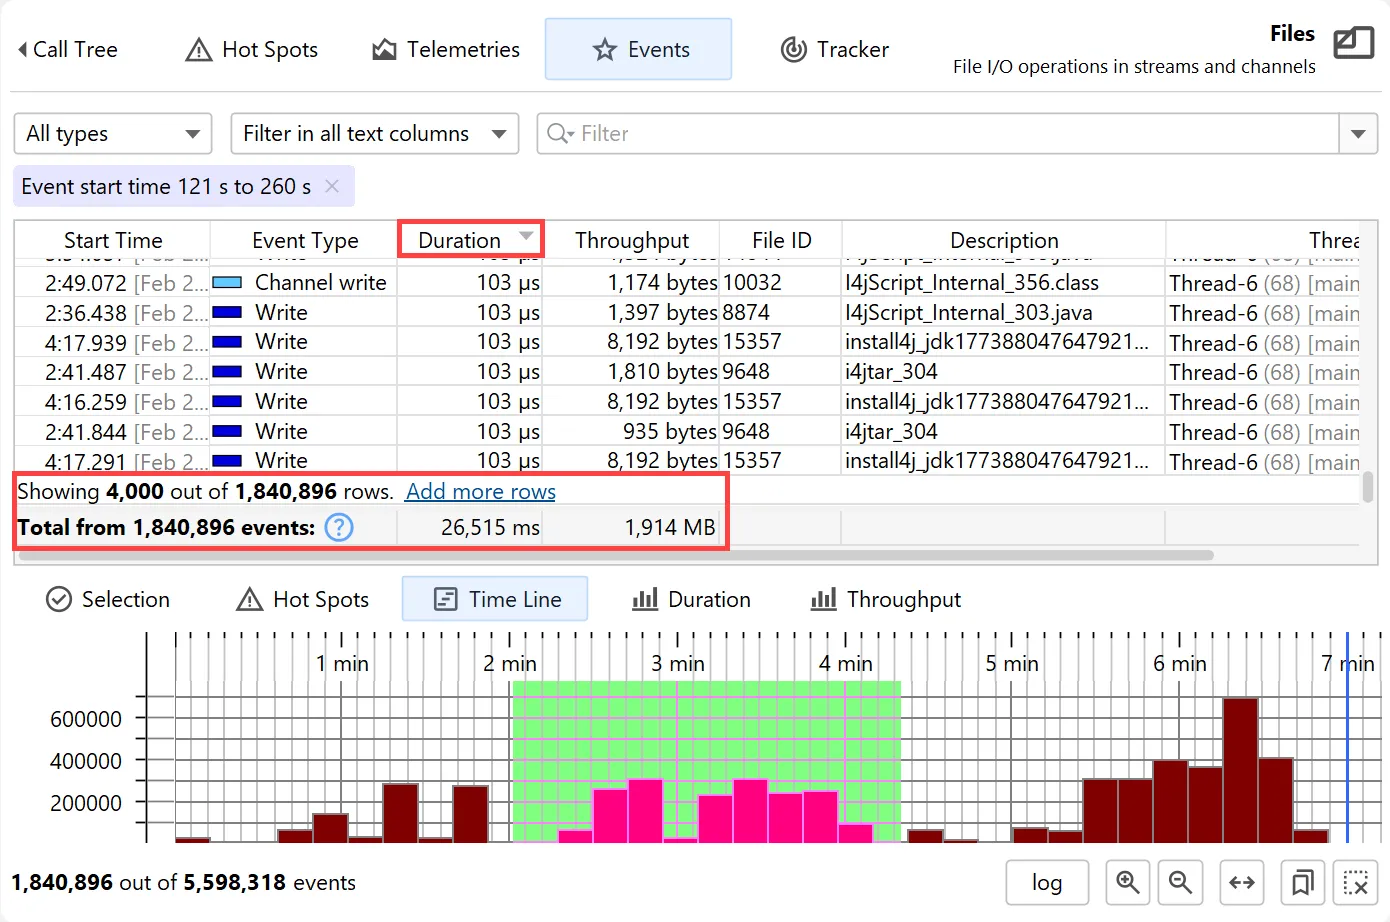
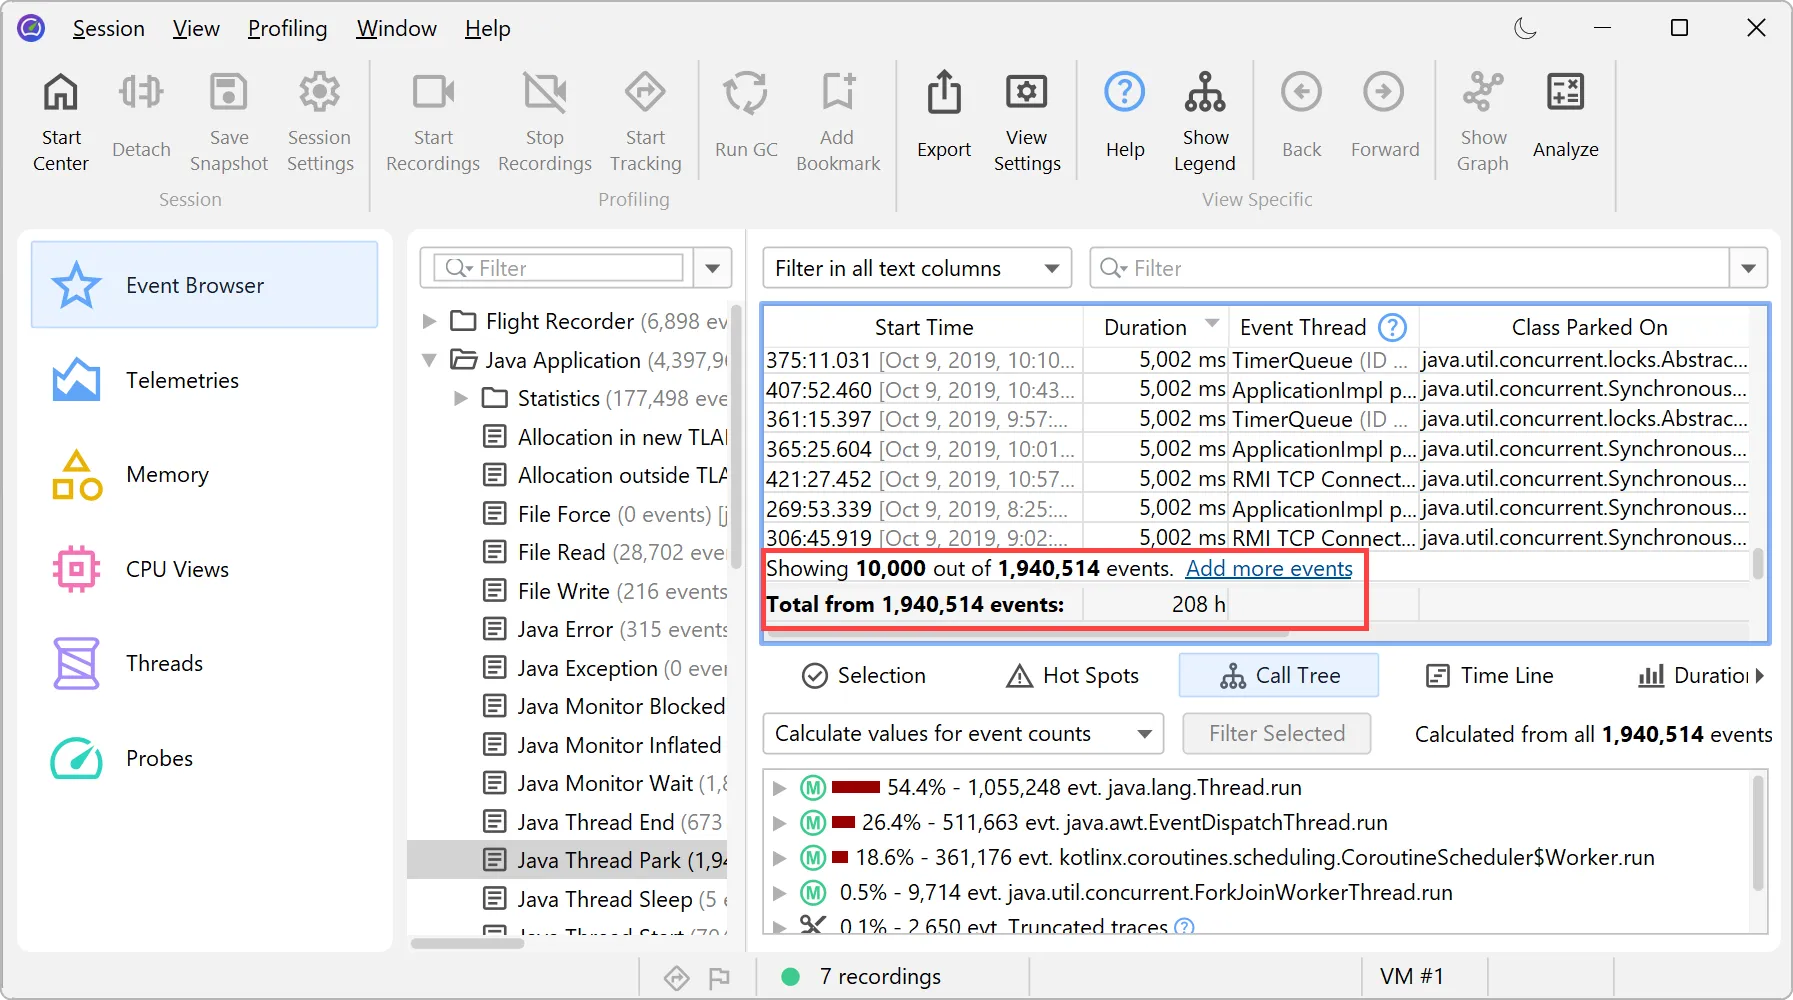
While the table only shows a limited number of events, you can add more events when scrolling to the bottom. When sorting by a column,
the entire set of filtered events is considered, not just the currently visible rows.
Totals in the table are also calculated for the entire set of filtered events.
The lower "Hot Spots" tab contains a CPU hot spots view, a probe hot spots view, and a probe call tree – similar to the "Selection"
tab, but calculated for all filtered events rather than the selected rows.
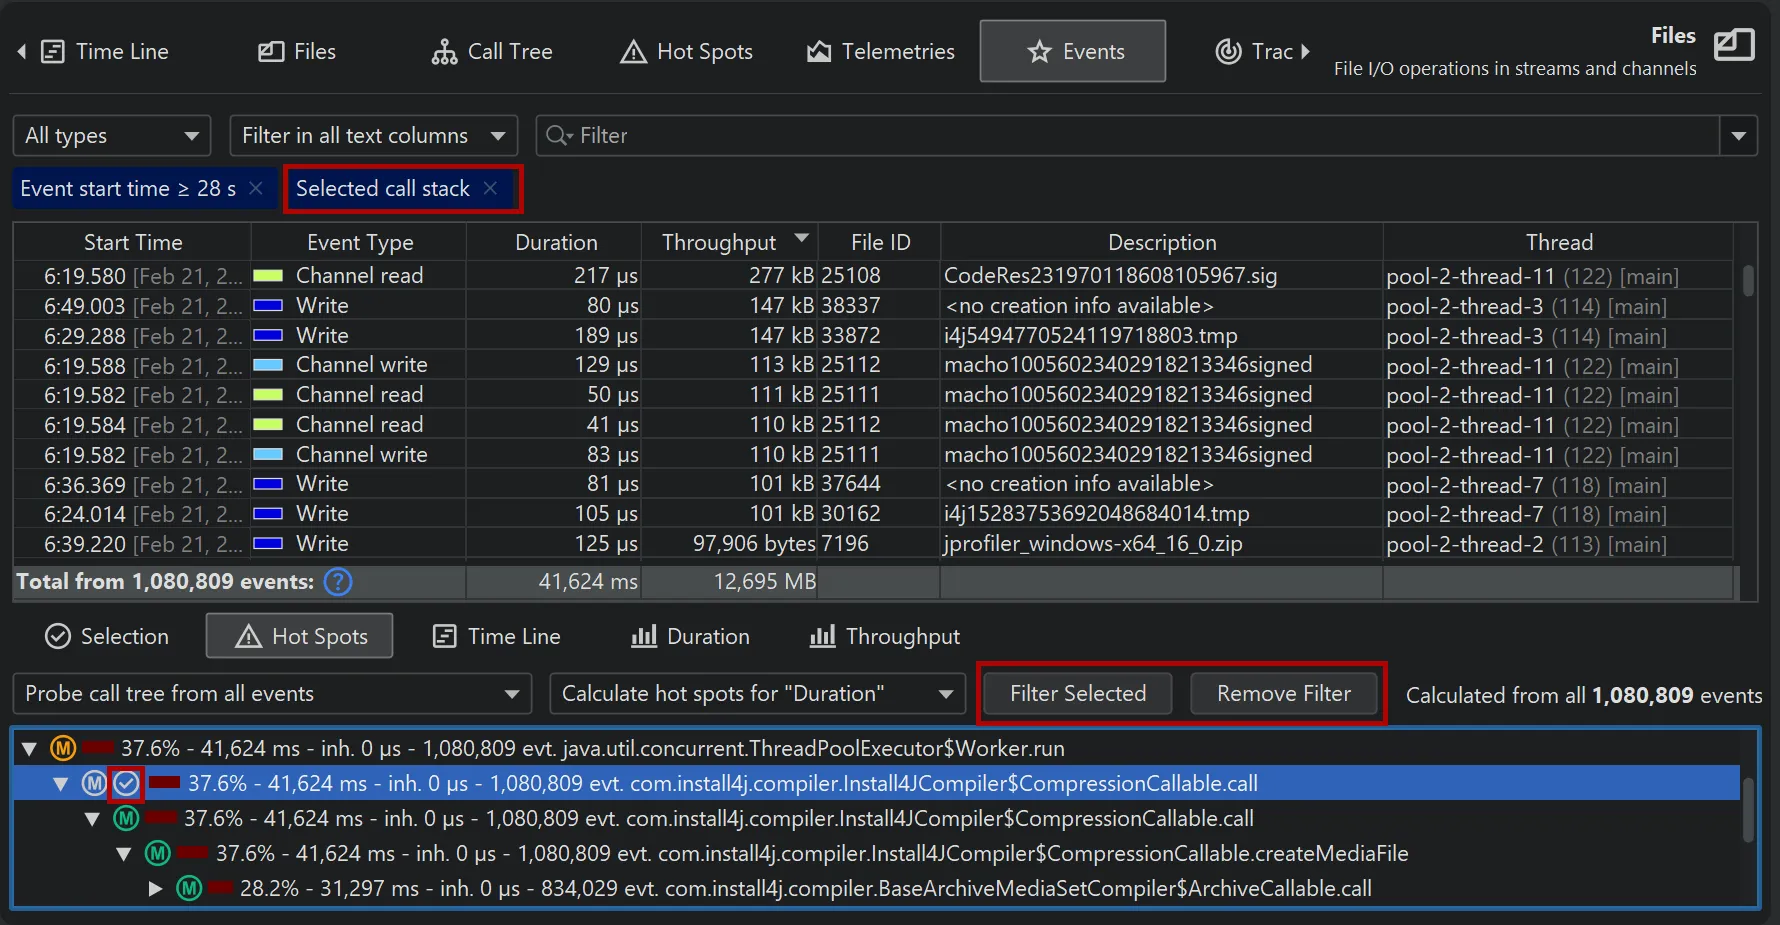
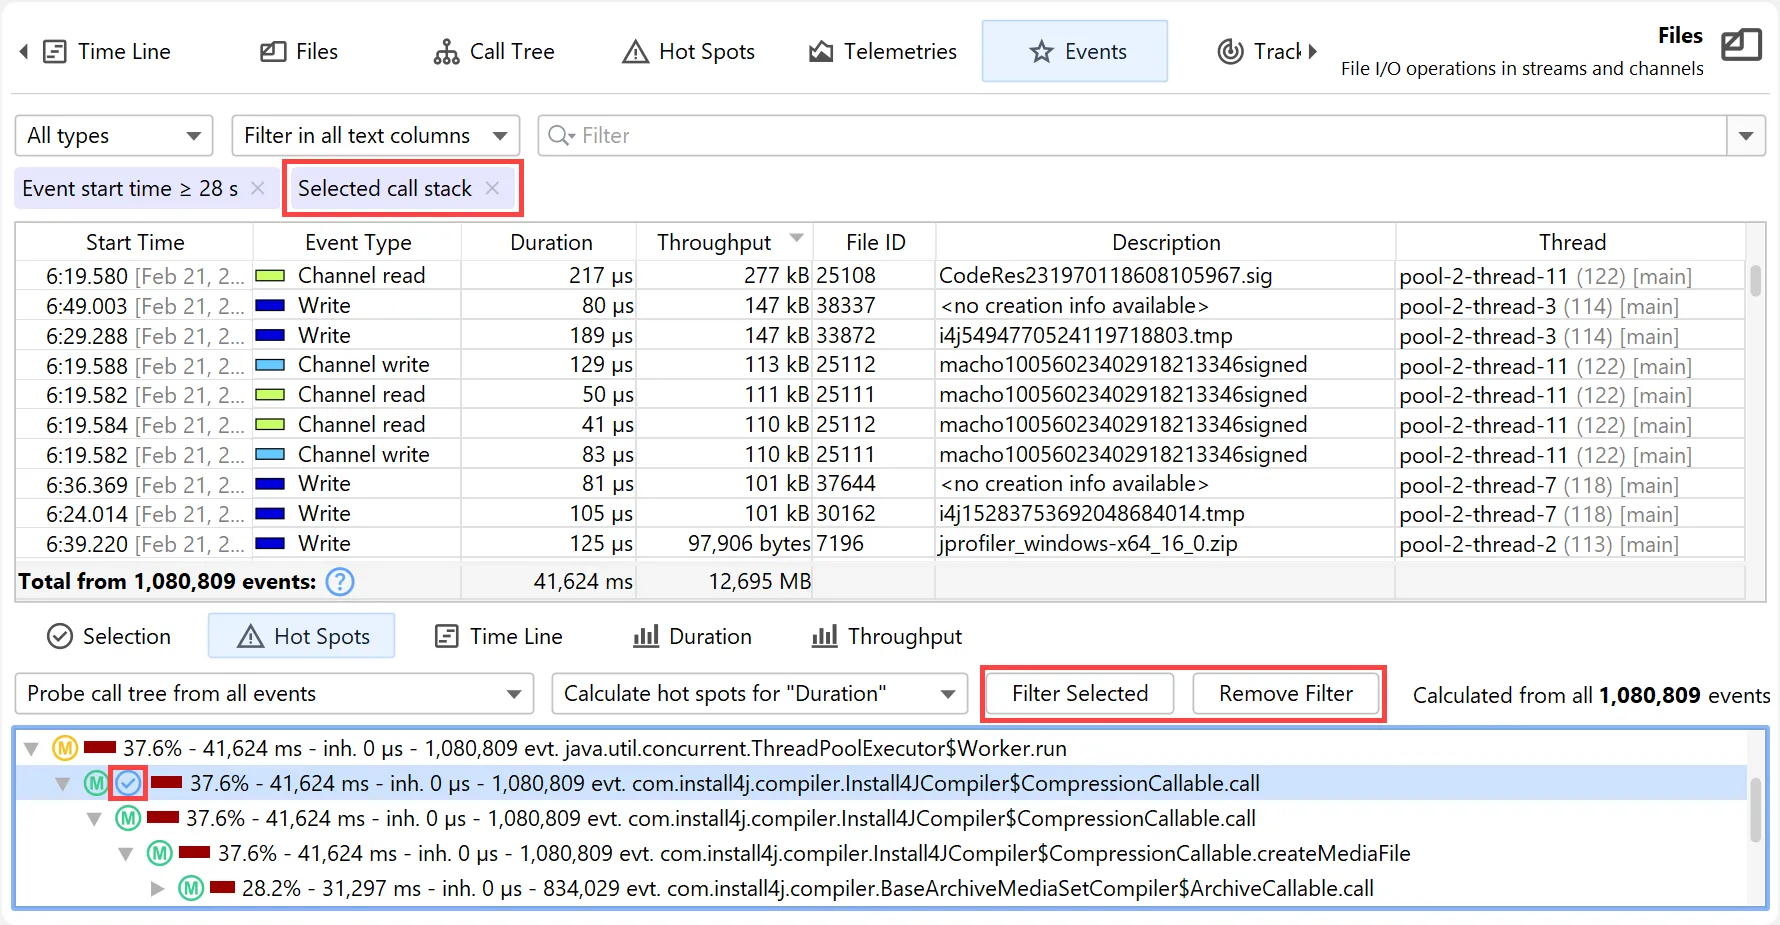
In each of these views, you can use the filter button to restrict the displayed events for the main event table and all other views
at the bottom. Below you can see a call stack filter in the probe call tree where the filtered node is marked with a filter icon.
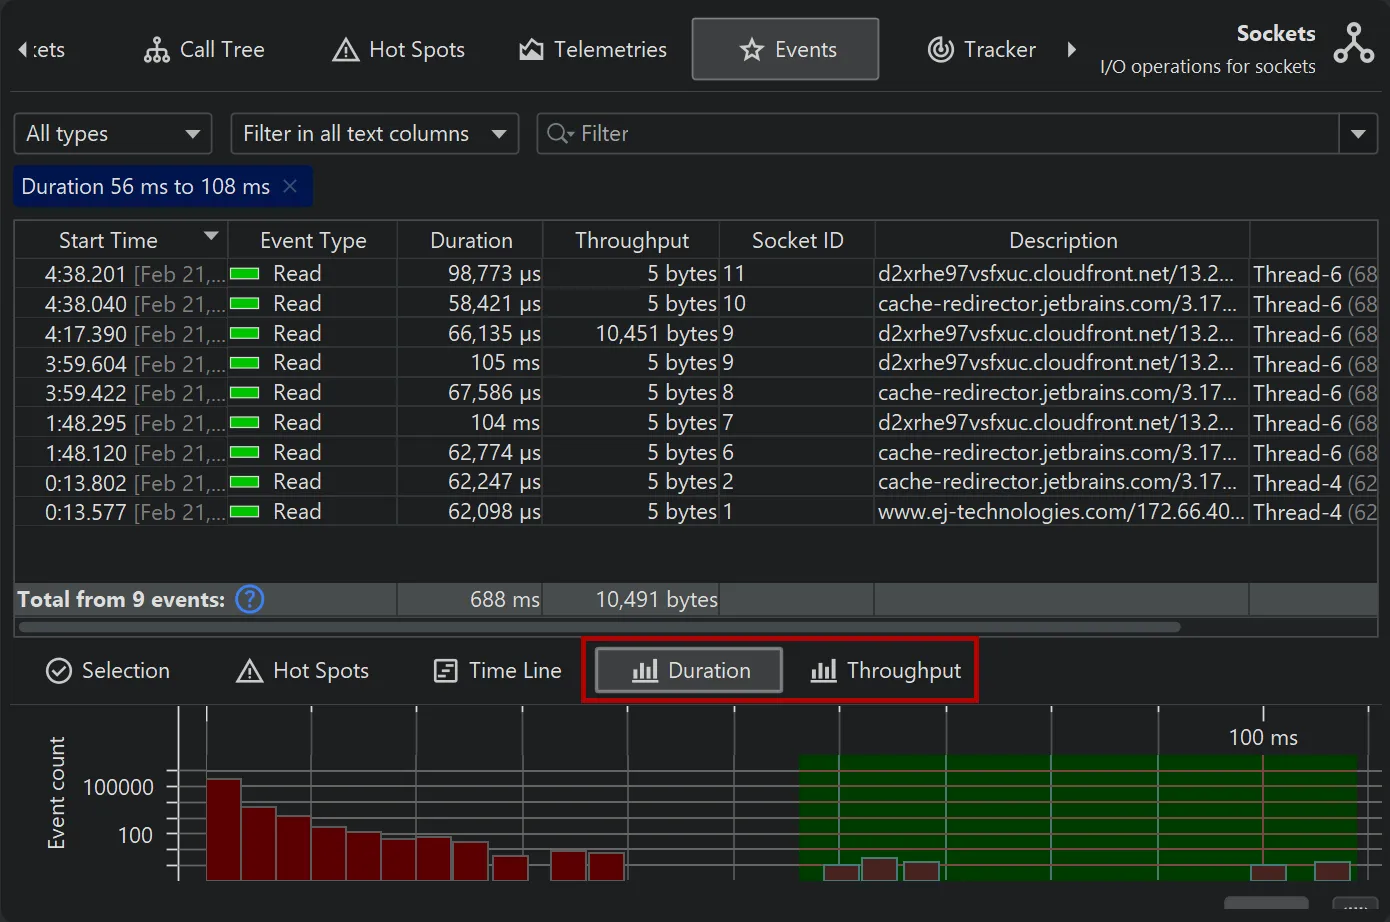
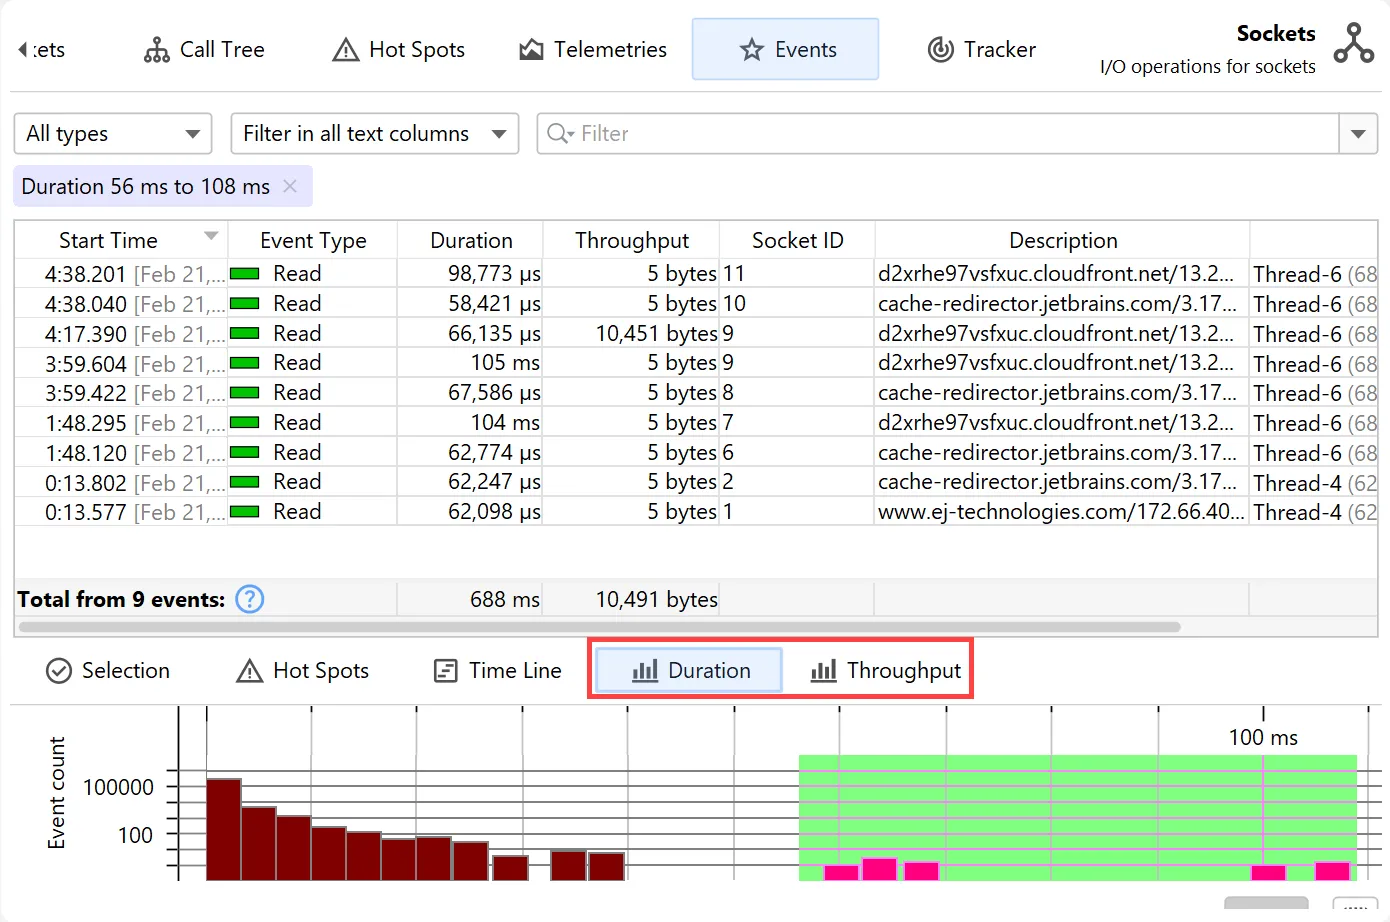
Depending on the measurements performed by a probe, additional histogram views are available at the bottom. For the "Files" and
the "Sockets" probes these are "Duration" and "Throughput".
Histograms can be shown with a logarithmic y-axis and support filtering by dragging a range with the mouse.
Finally, smart column management in the events view has been implemented. Based on the width of all columns and the available
viewport width, JProfiler decides whether to fit the columns into the viewport or activate horizontal scrolling. Resizing columns manually
disables the "fit-to-viewport" mode, which automatically reactivates if the total table width becomes smaller than the viewport.
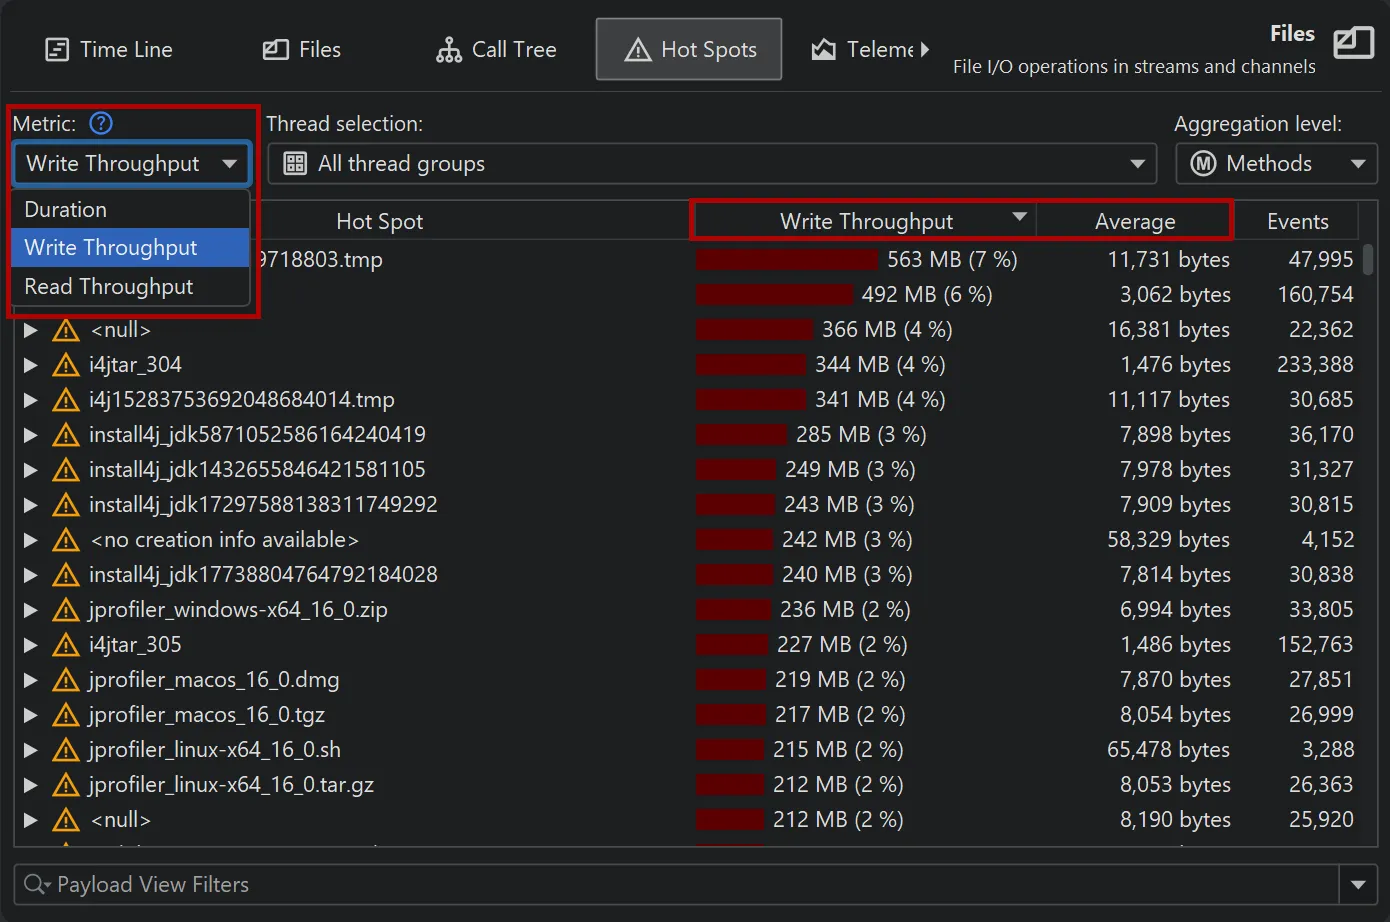
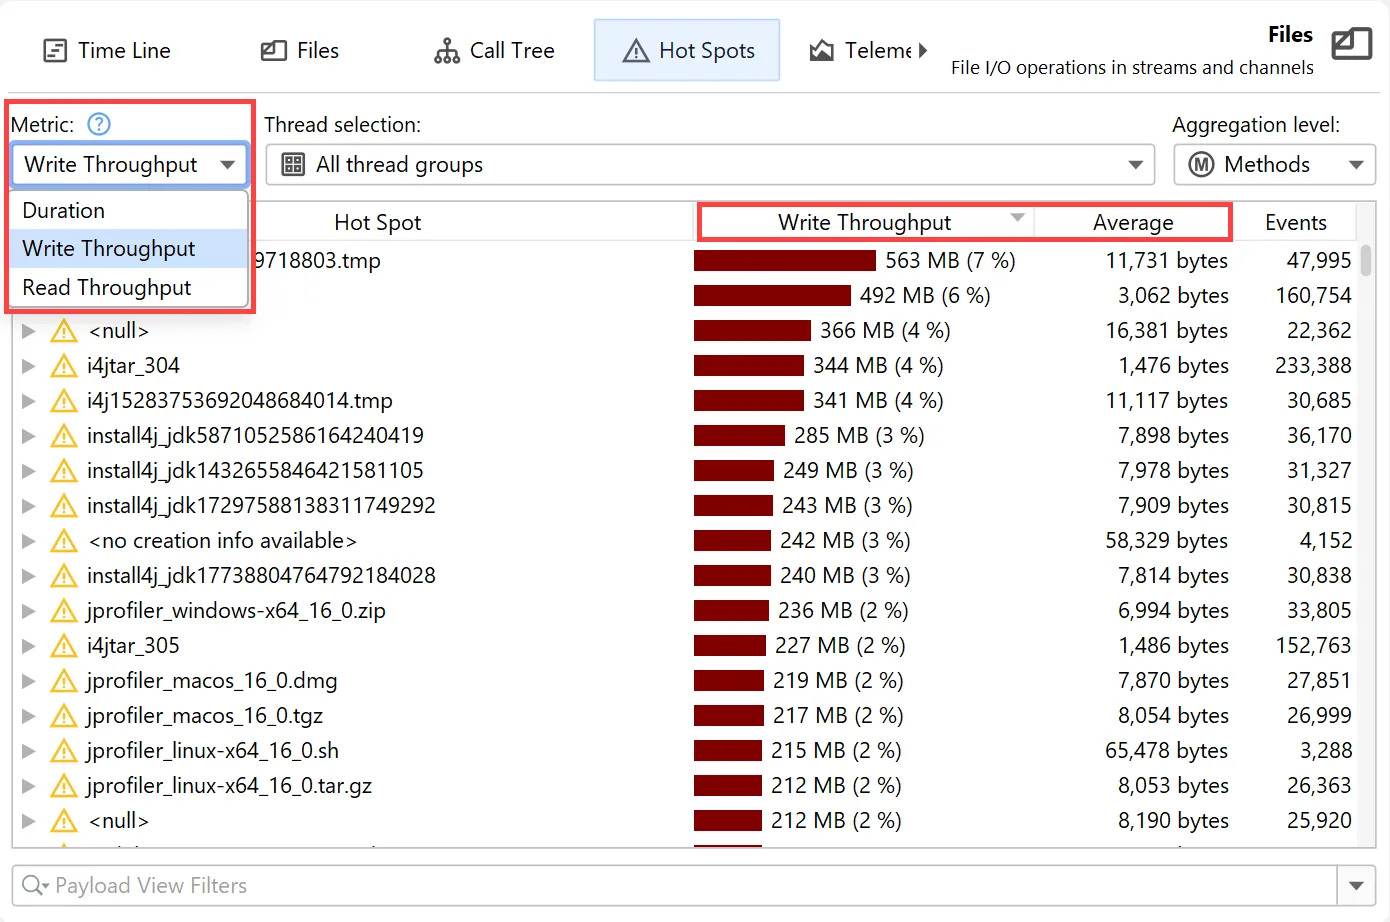
The probe call tree and probe hot spots views now have a metric selector if a probe has additional measurements beyond
event duration. For example, the "Files" and the "Sockets" probes also offer "Read Throughput" and "Write Throughput".
Selecting one of the throughput metrics automatically restricts the view to "Read" or "Write" events, respectively.
Changing the metric recalculates hot spots and updates the hot paths in the probe call tree.
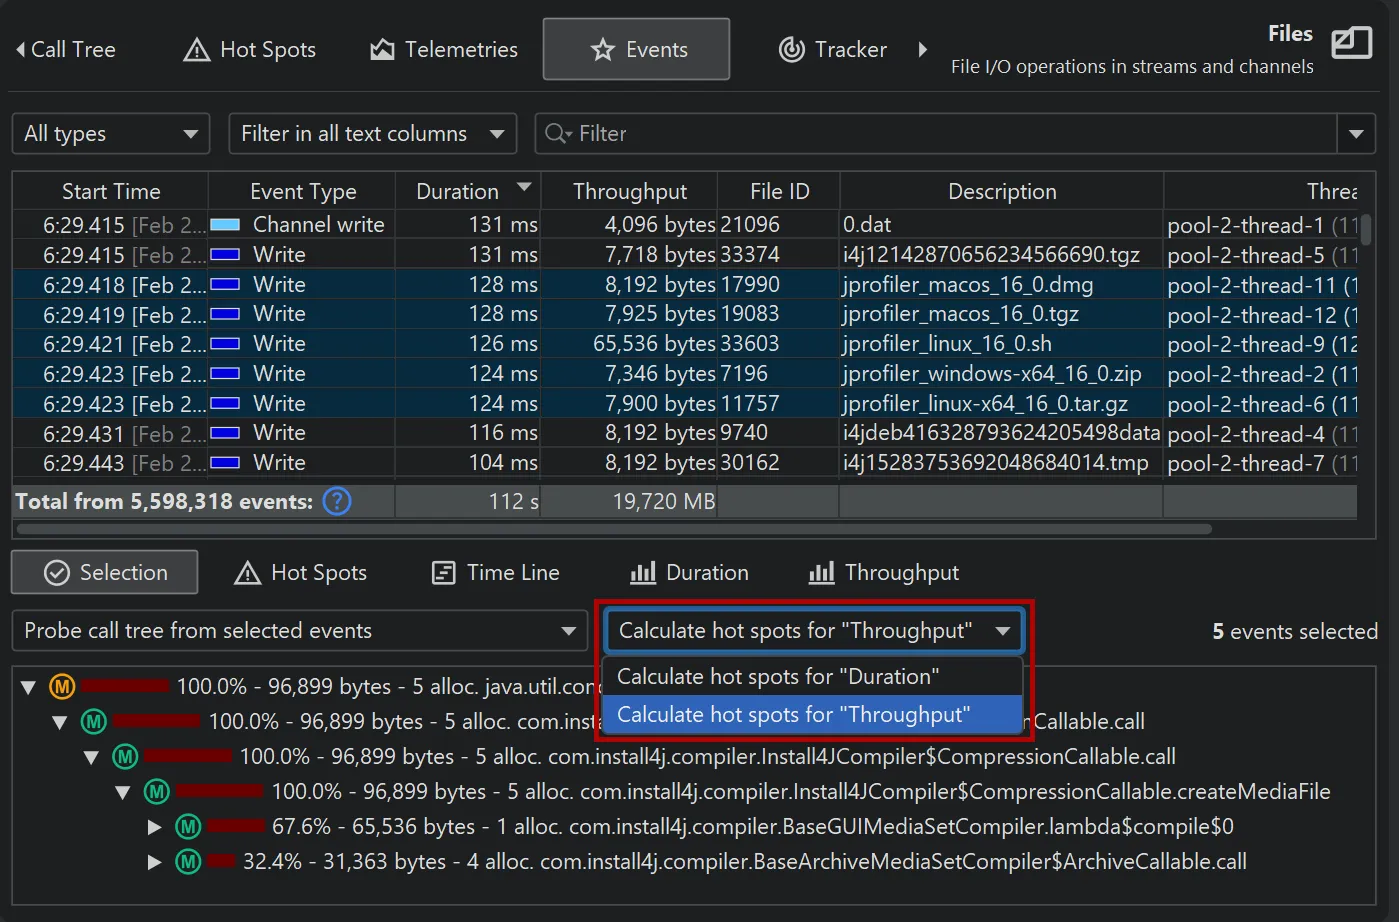
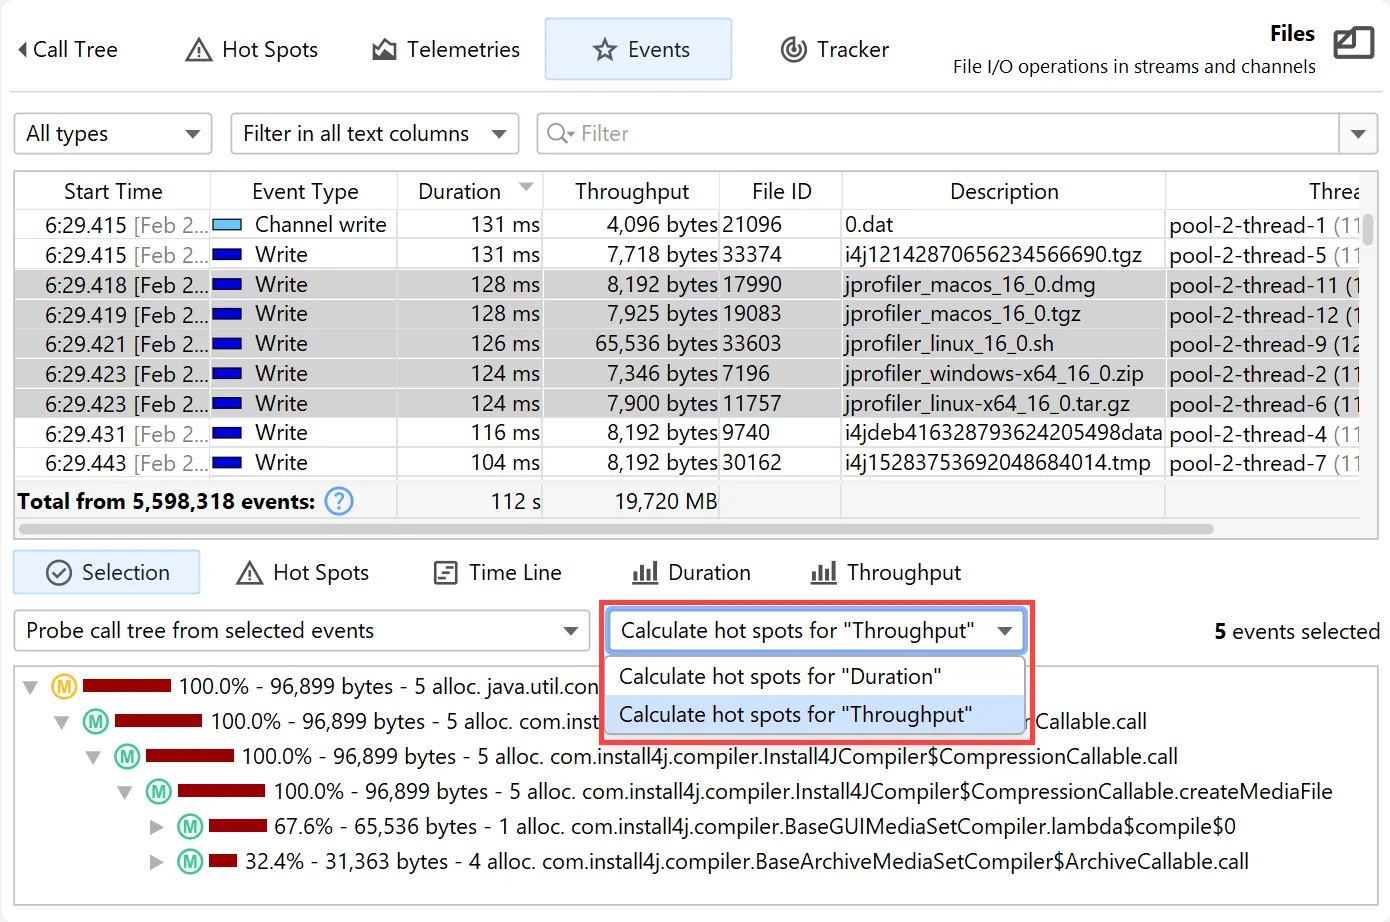
Metric selectors are now also available on the "Selection" and "Hot Spots" tabs of the probe events view. Since "Read" and "Write"
events can be filtered separately in the events view, there is a single combined "Throughput" measurement.
JProfiler 16 delivers many improvements for JFR support.
- Responsiveness in the event browser for large event counts has been improved by pre-calculating the data in the lower views.
-
Previous versions of JProfiler only handled a maximum number of events in the event table. You can now load additional events by scrolling
to the bottom. Additionally, when sorting the table, all filtered events are considered rather than just the visible subset.
- The totals in the event table are now calculated for all filtered events, not just for the currently displayed ones.
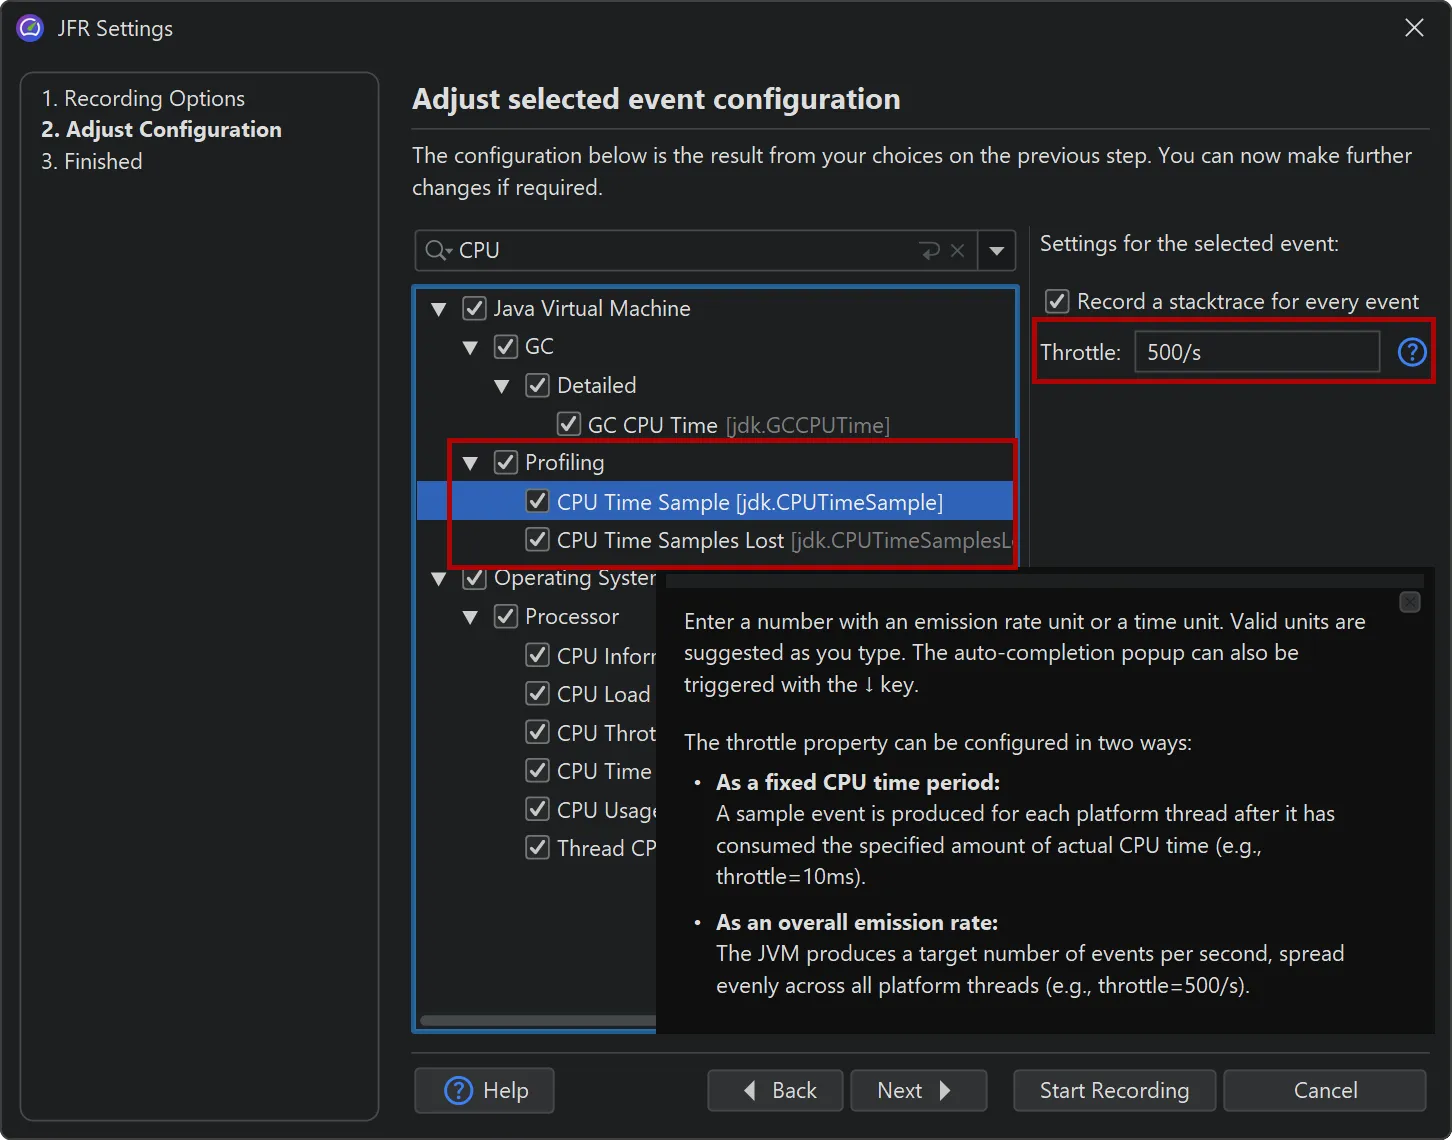
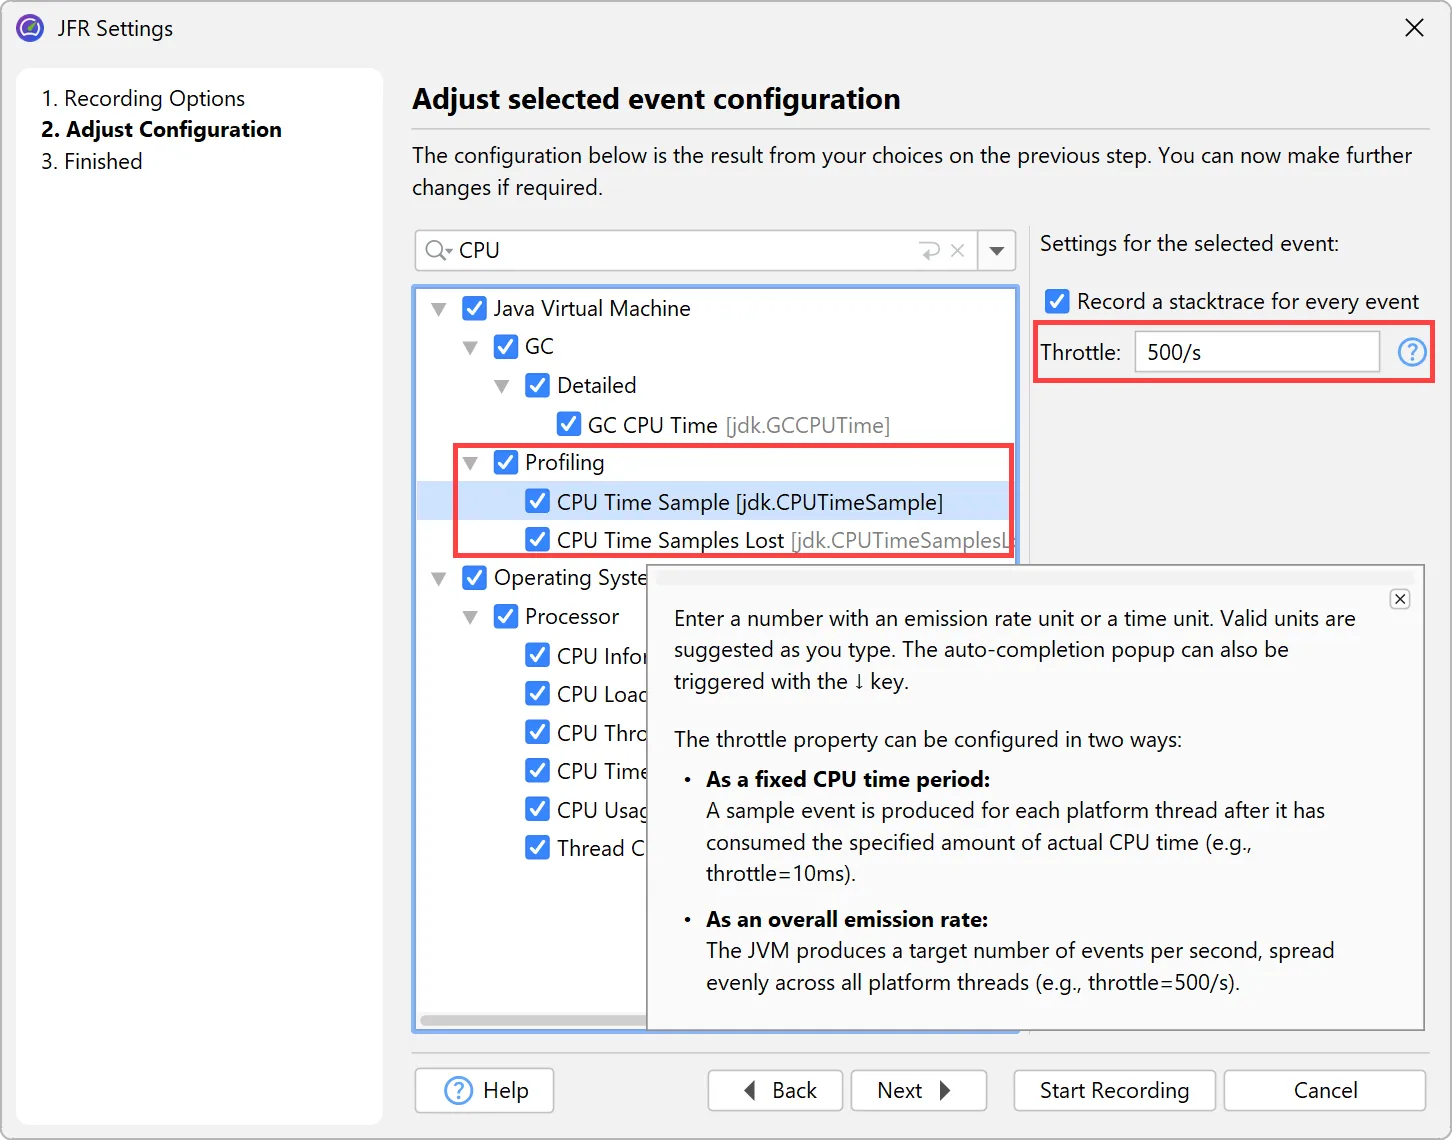
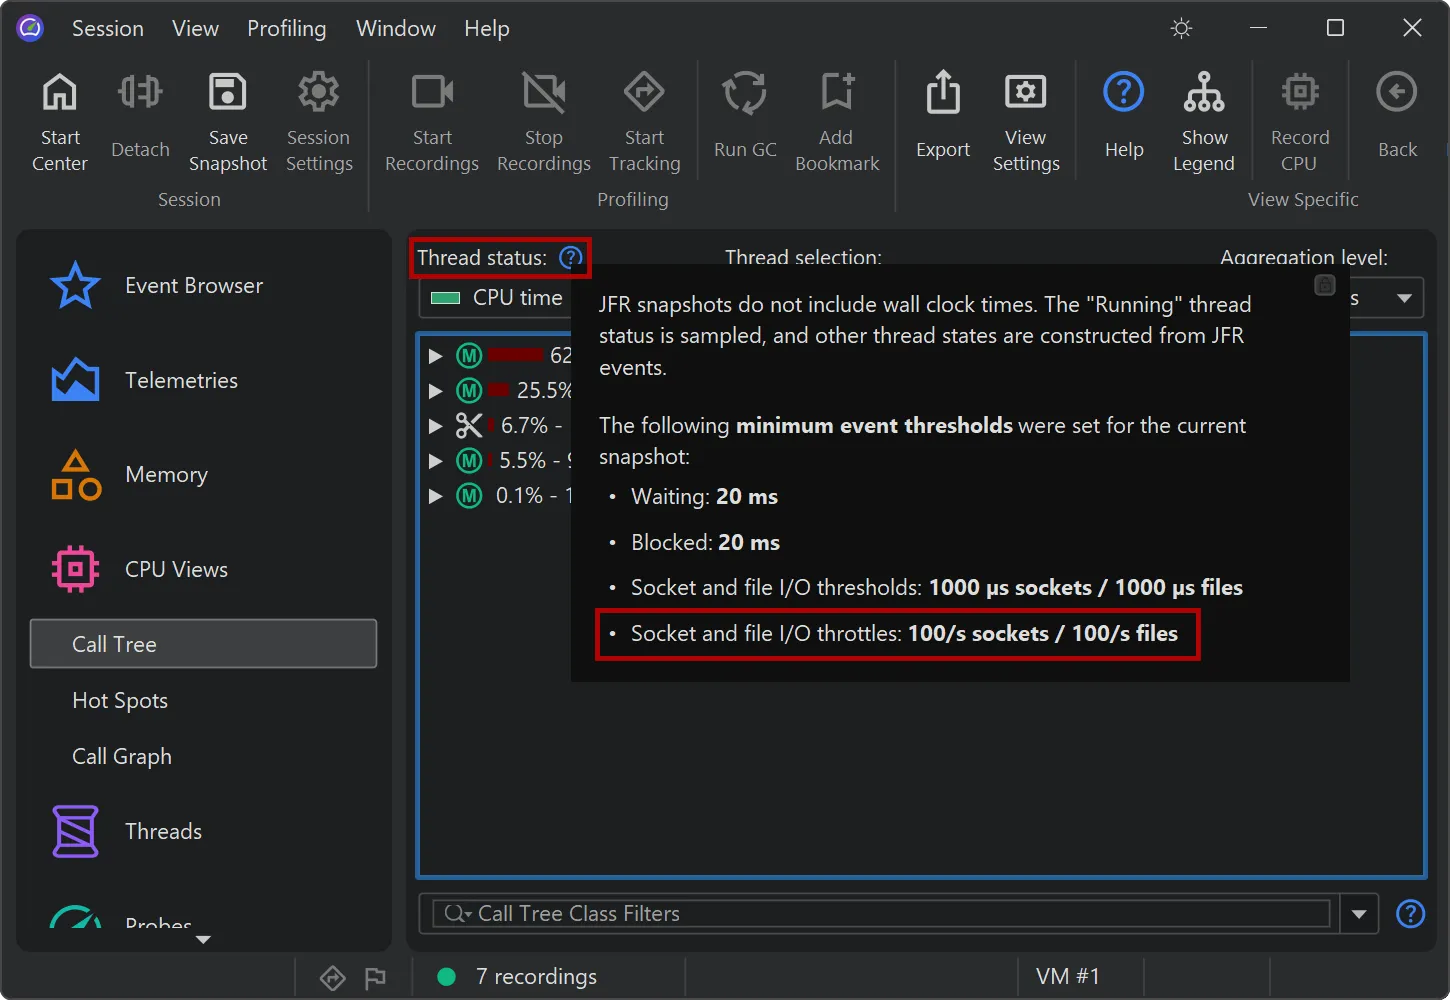
Support for throttle settings has been added in the JFR recording wizard. For example, the new jdk.CPUTimeSample event in
Java 25 is configured via throttling. You can alternatively enter a period or an emission rate with a /s unit.
Throttle settings are also displayed in the CPU views next to the thread status selector.
For calculating data in the CPU section, the new Linux-only jdk.CPUTimeSample event (Java 25+) is now used if recorded,
instead of the older jdk.ExecutionSample event. Unlike jdk.ExecutionSample, which works on all platforms, but has
limitations in the number of threads it samples and the accuracy of CPU usage, jdk.CPUTimeSample uses CPU time events from
the Linux kernel to collect data.
With this event, CPU profiling with JFR can now provide actionable CPU metrics on production systems where loading a JVMTI agent is not
permitted.
Starting with JProfiler 16, all experimental JFR events are now shown in the event browser, such as the jdk.CPUTimeSample
event.
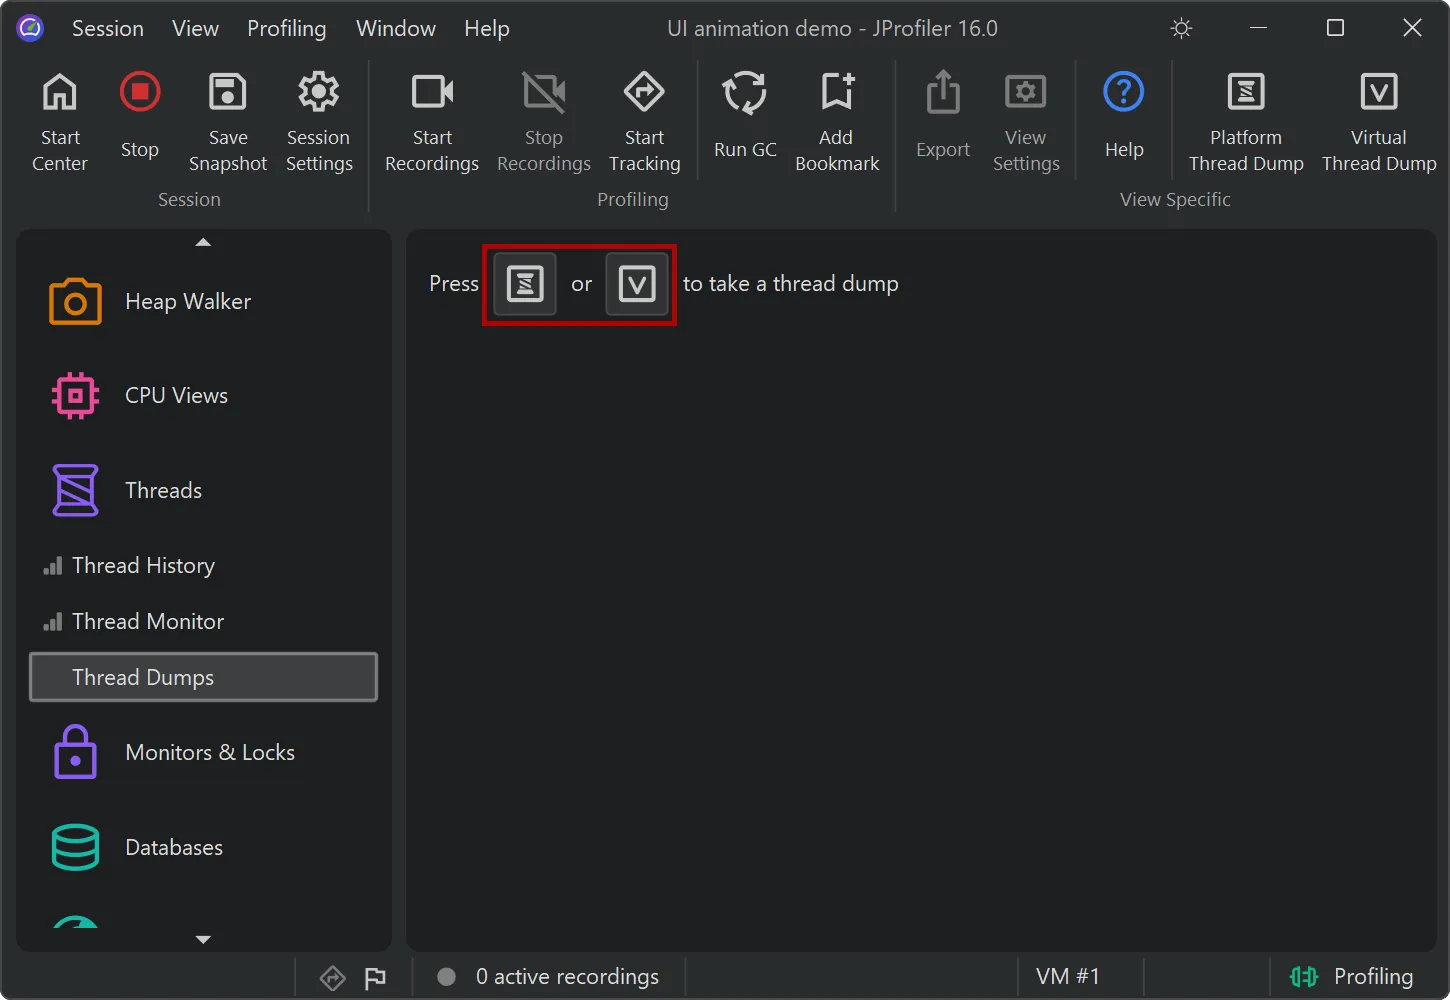
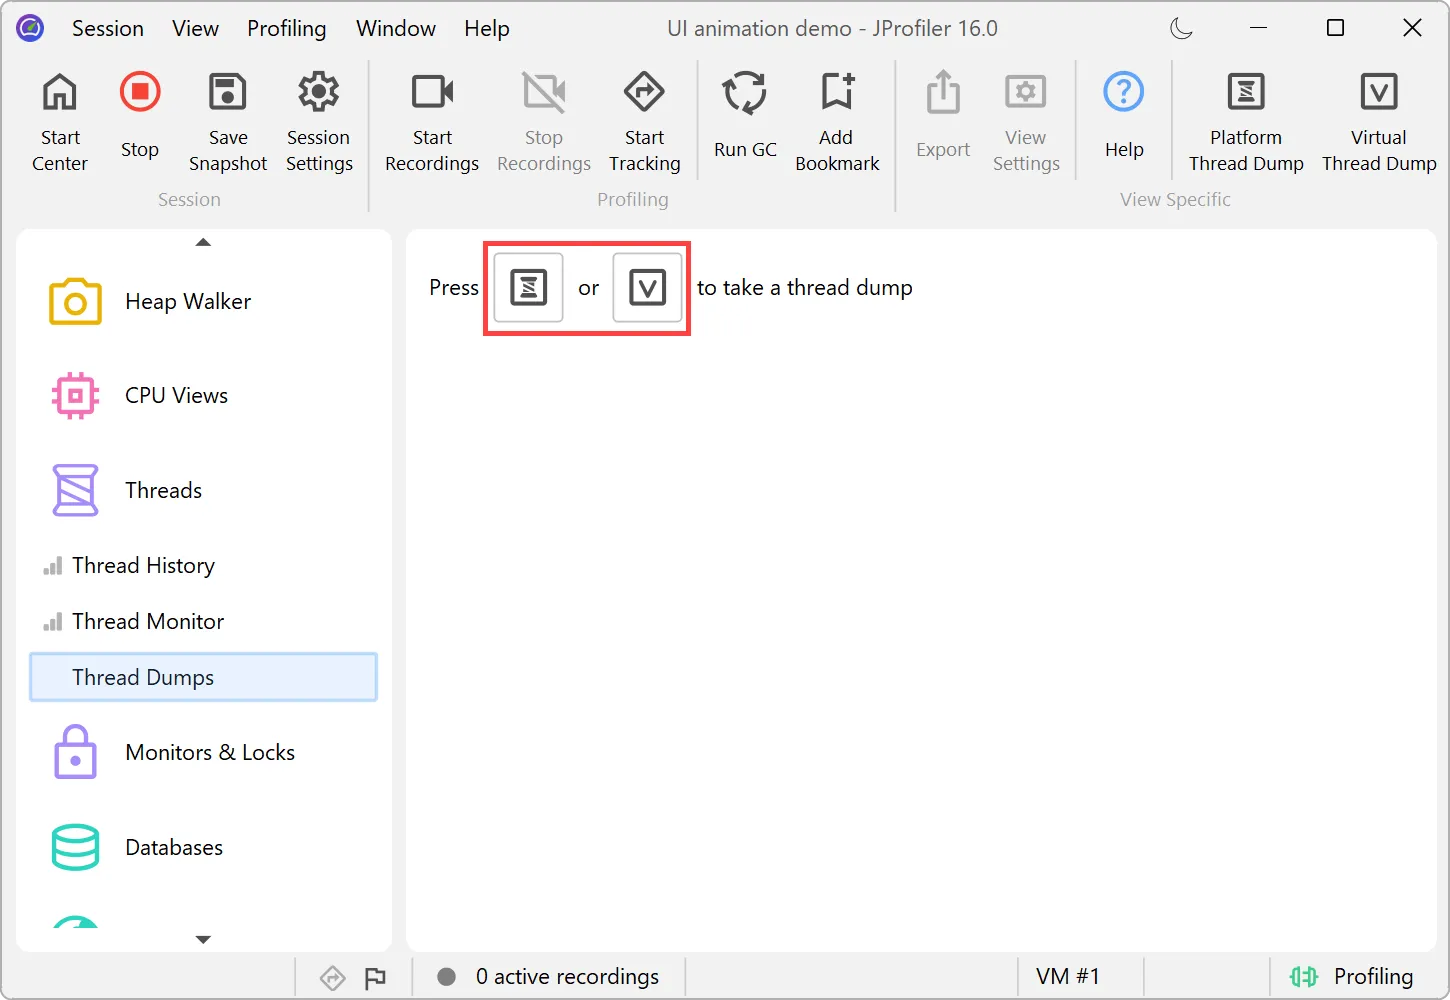
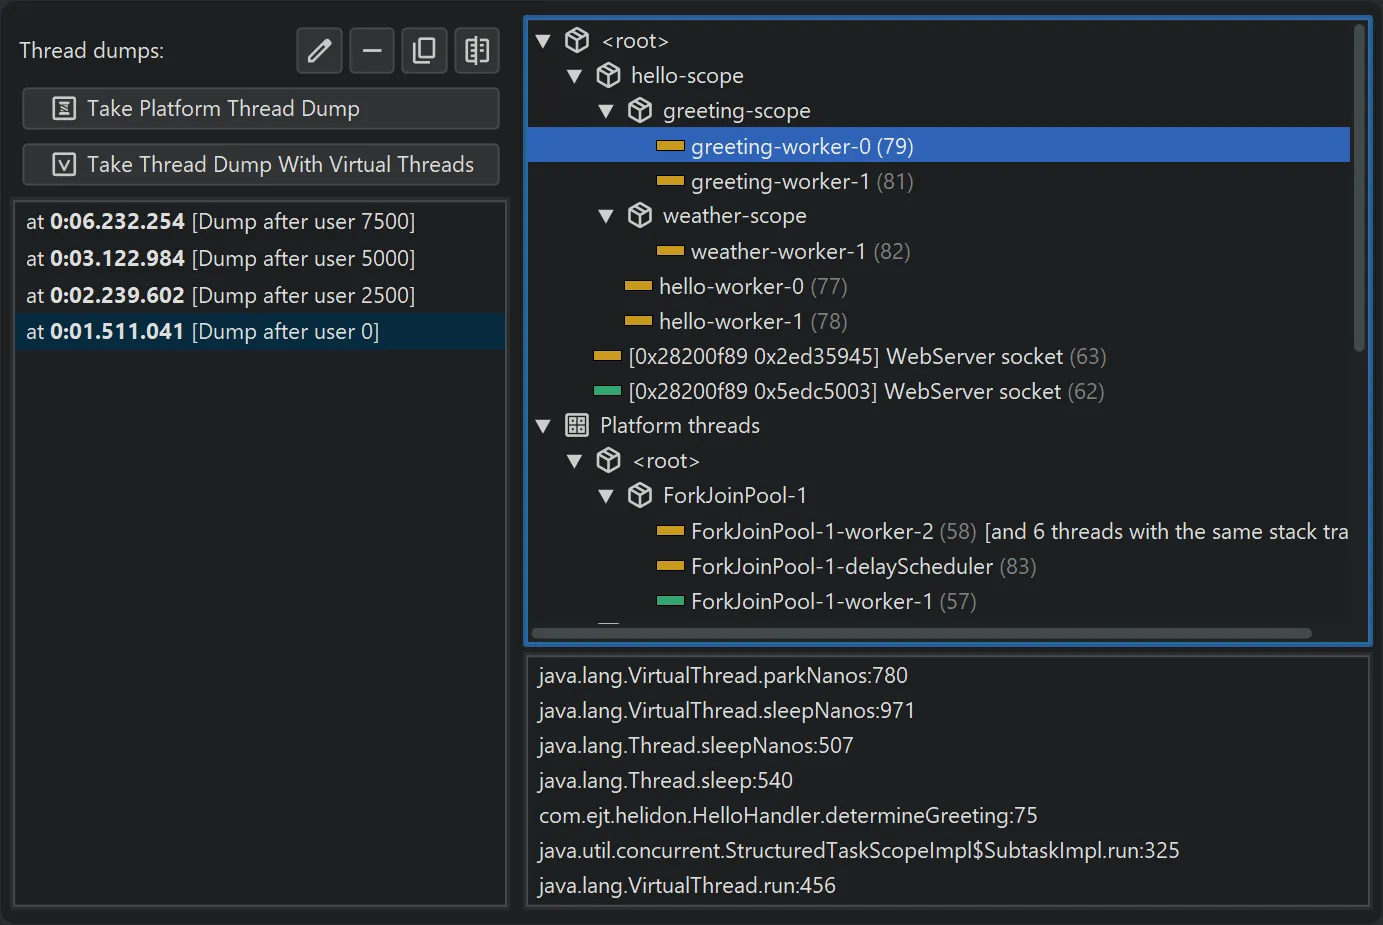
JProfiler 16 introduces support for virtual thread dumps.
The thread dumps view now features two distinct actions: one for platform thread dumps and another for virtual thread dumps.
While the virtual thread dump also includes platform threads, it is asynchronous, so synchronous platform
thread dumps are preferable when not working with virtual threads.
Virtual threads are hierarchically organized within their thread containers. This is relevant when using
structured concurrency, which is still a preview feature as of Java 25.
In structured concurrency, each scope creates a corresponding thread container. Since a dump may contain millions of virtual threads
in deeply nested containers, virtual thread dumps can be significantly larger than platform thread dumps.
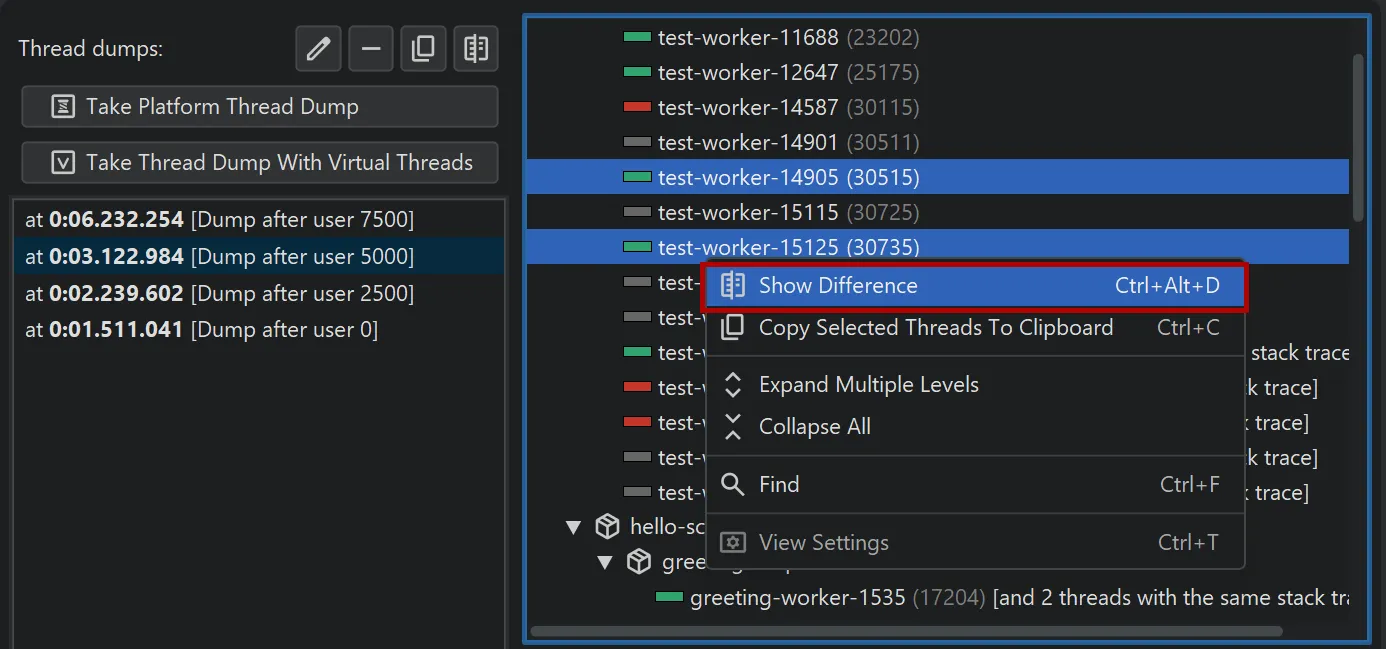
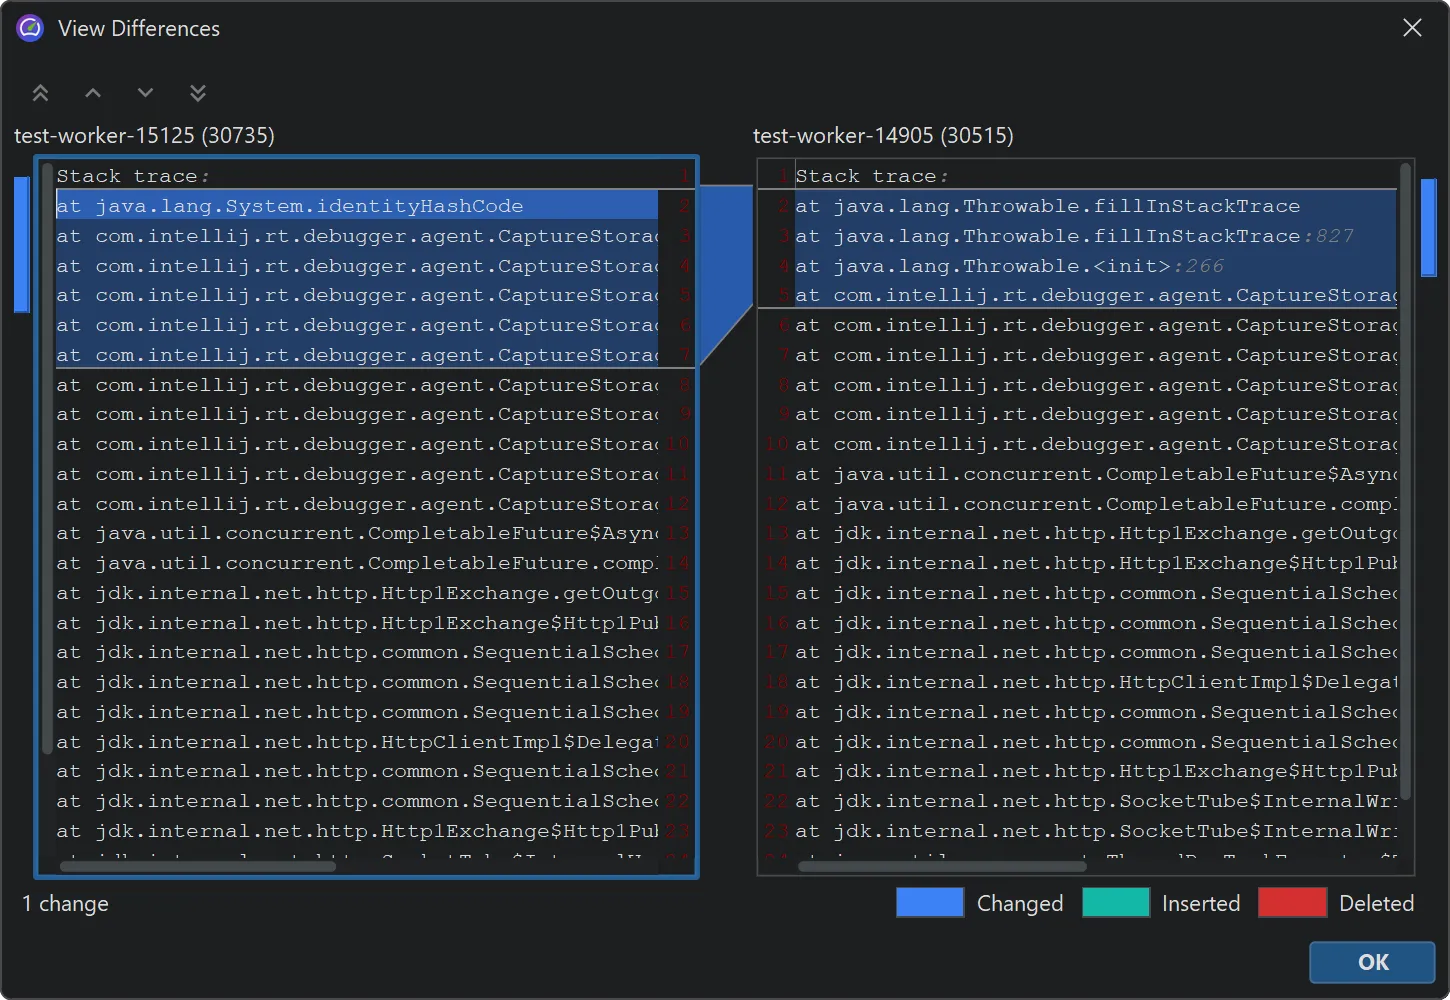
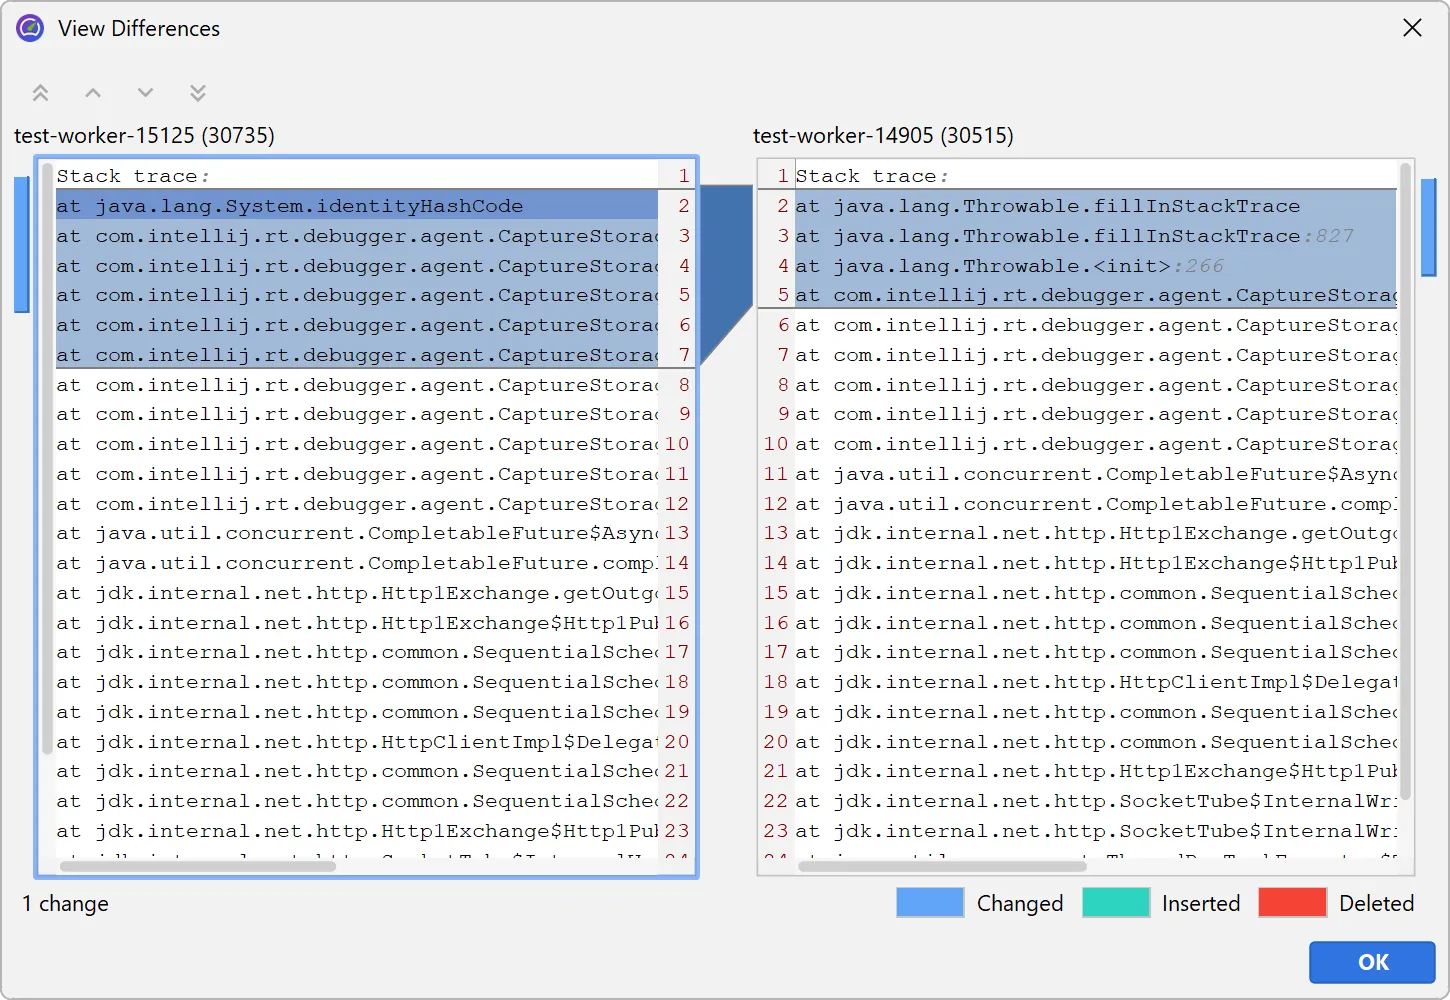
You can compare two single virtual threads or two entire thread dumps by selecting them and choosing the comparison action in the
context menu.
The comparison is shown in a diff viewer in a separate window.
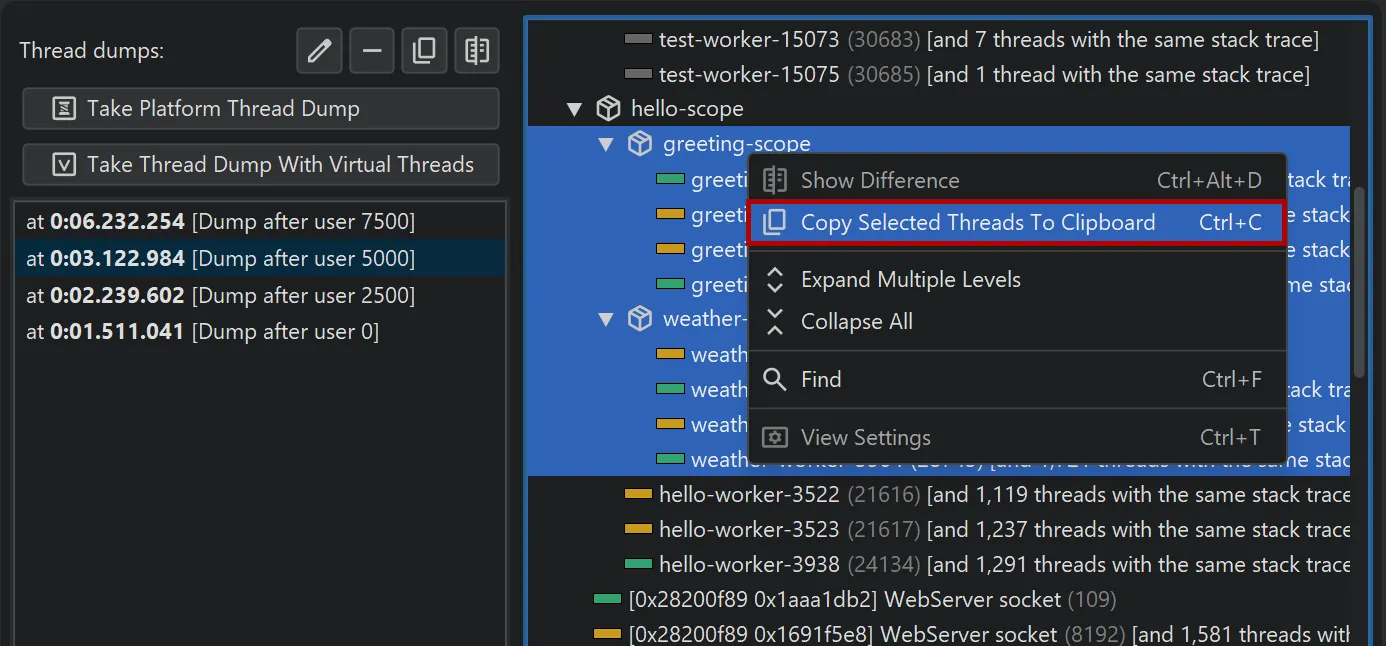
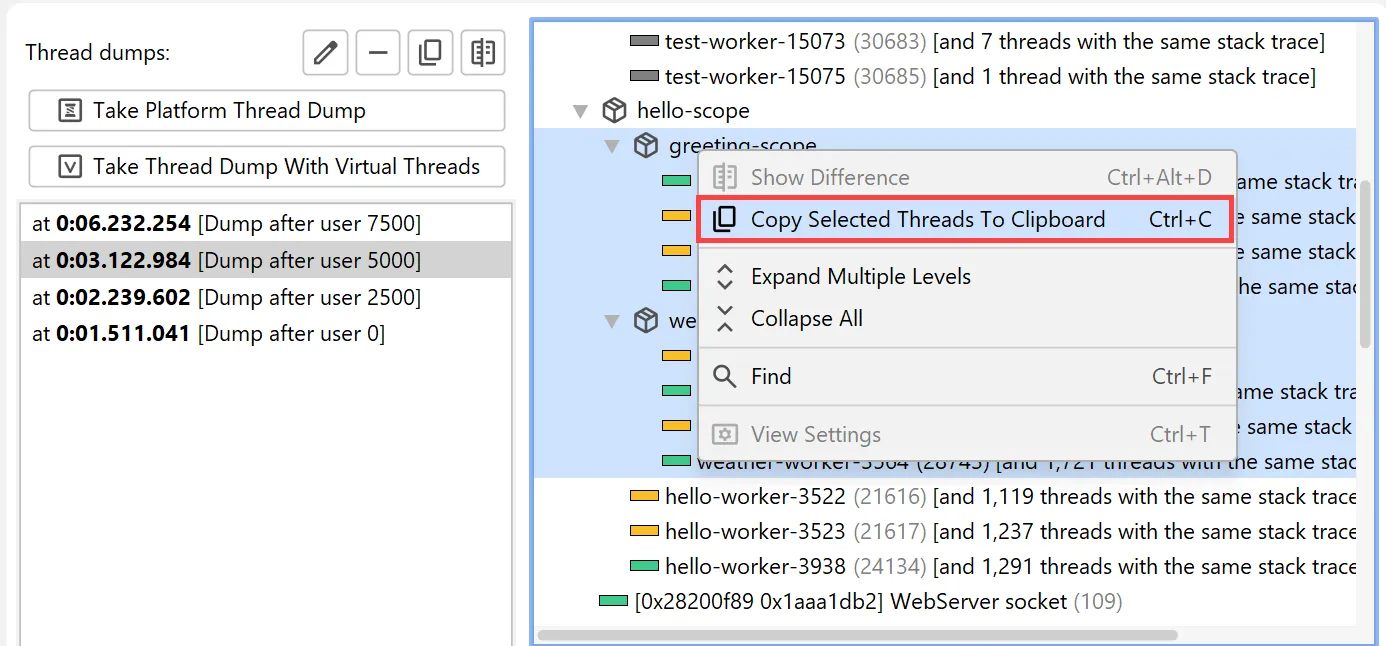
To copy single threads, multiple threads, or entire thread dumps to the clipboard, use the corresponding action in the context menu.
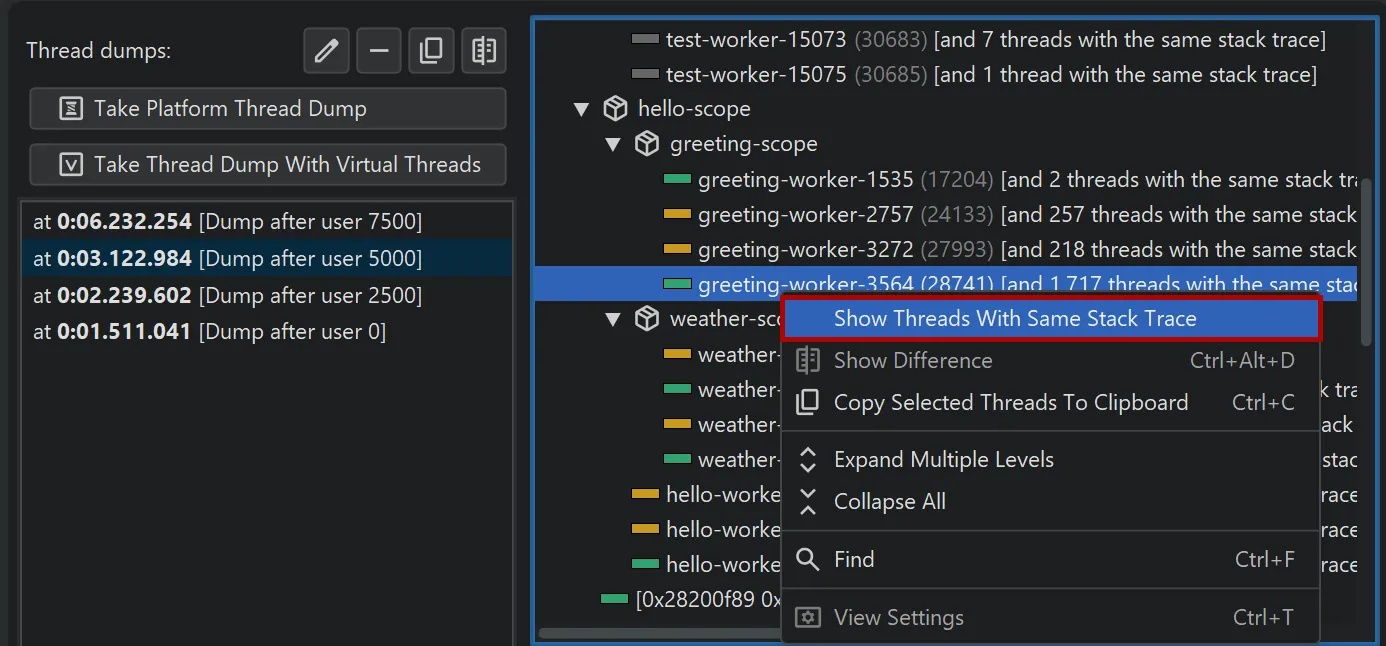
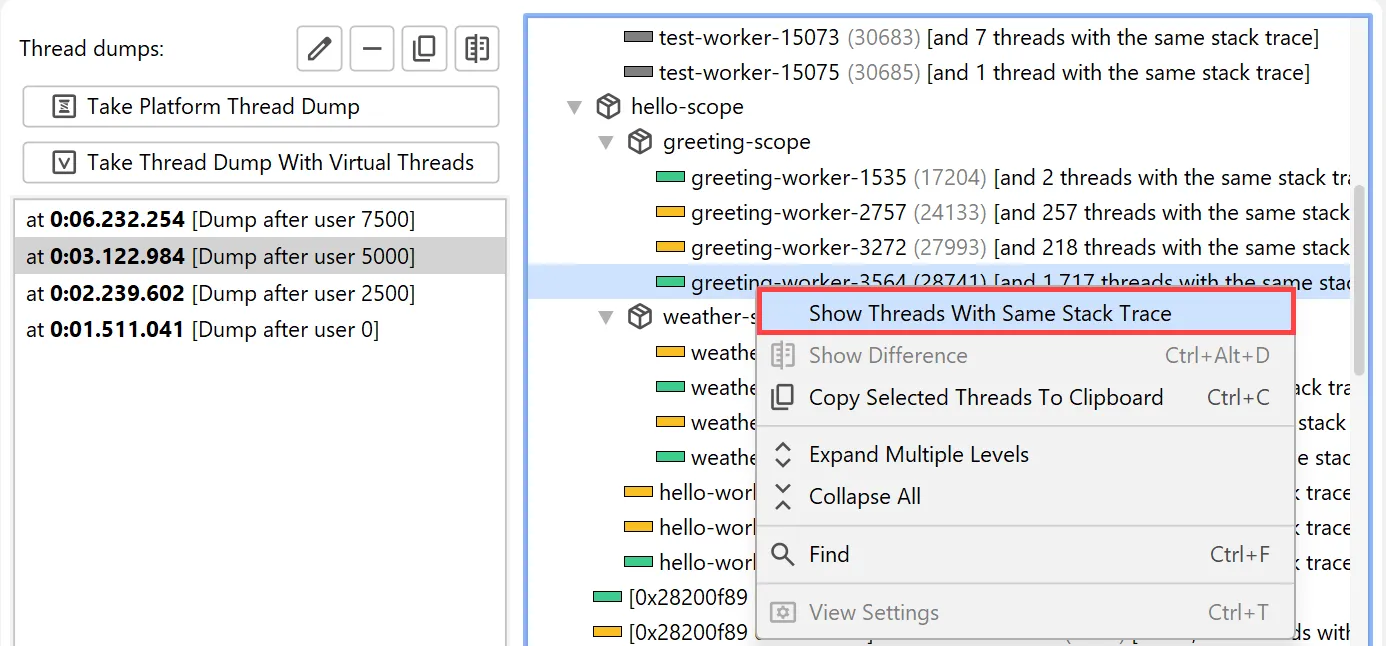
Virtual thread dumps group threads with the same stack trace in the same hierarchical position into a single node.
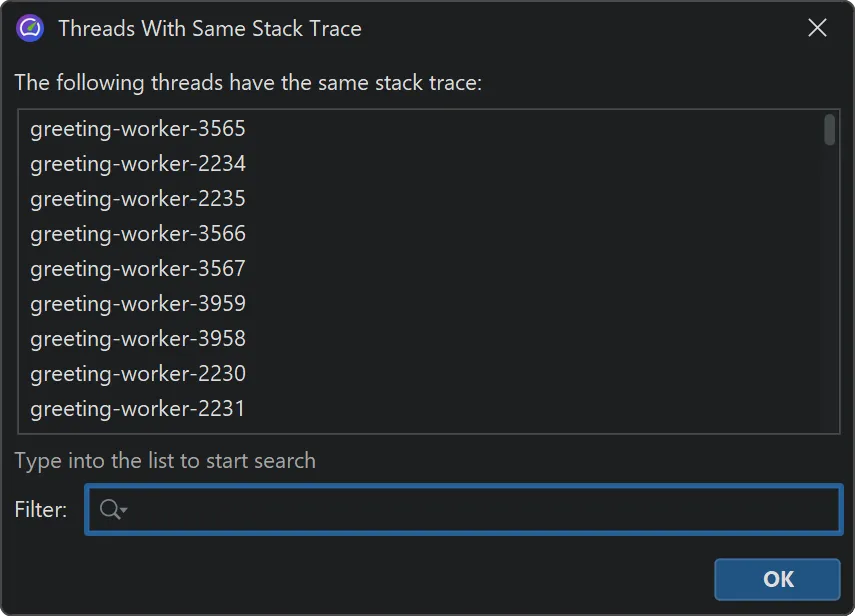
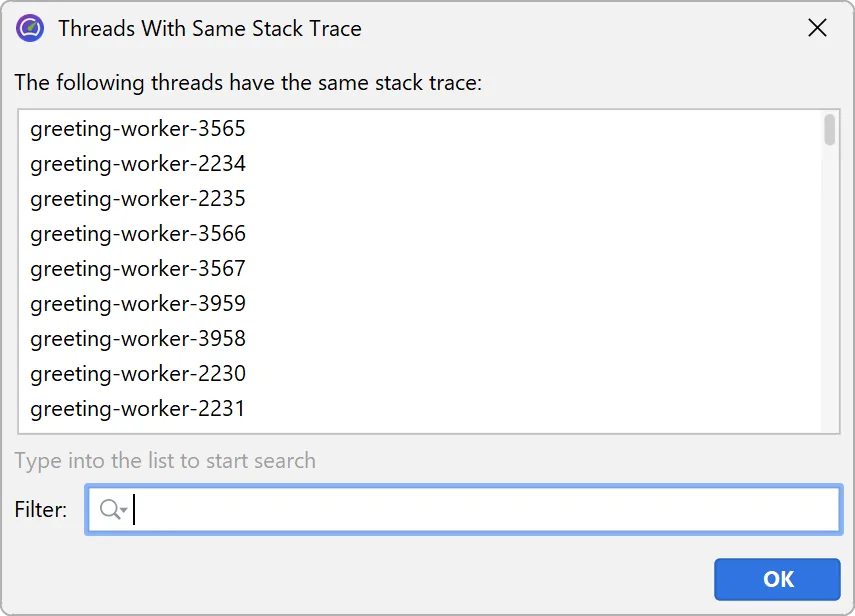
The context menu contains an action to show all grouped thread names.
The names of grouped threads are displayed in a separate window where you can filter for thread names of interest.
Thread grouping is also supported for platform thread dumps.
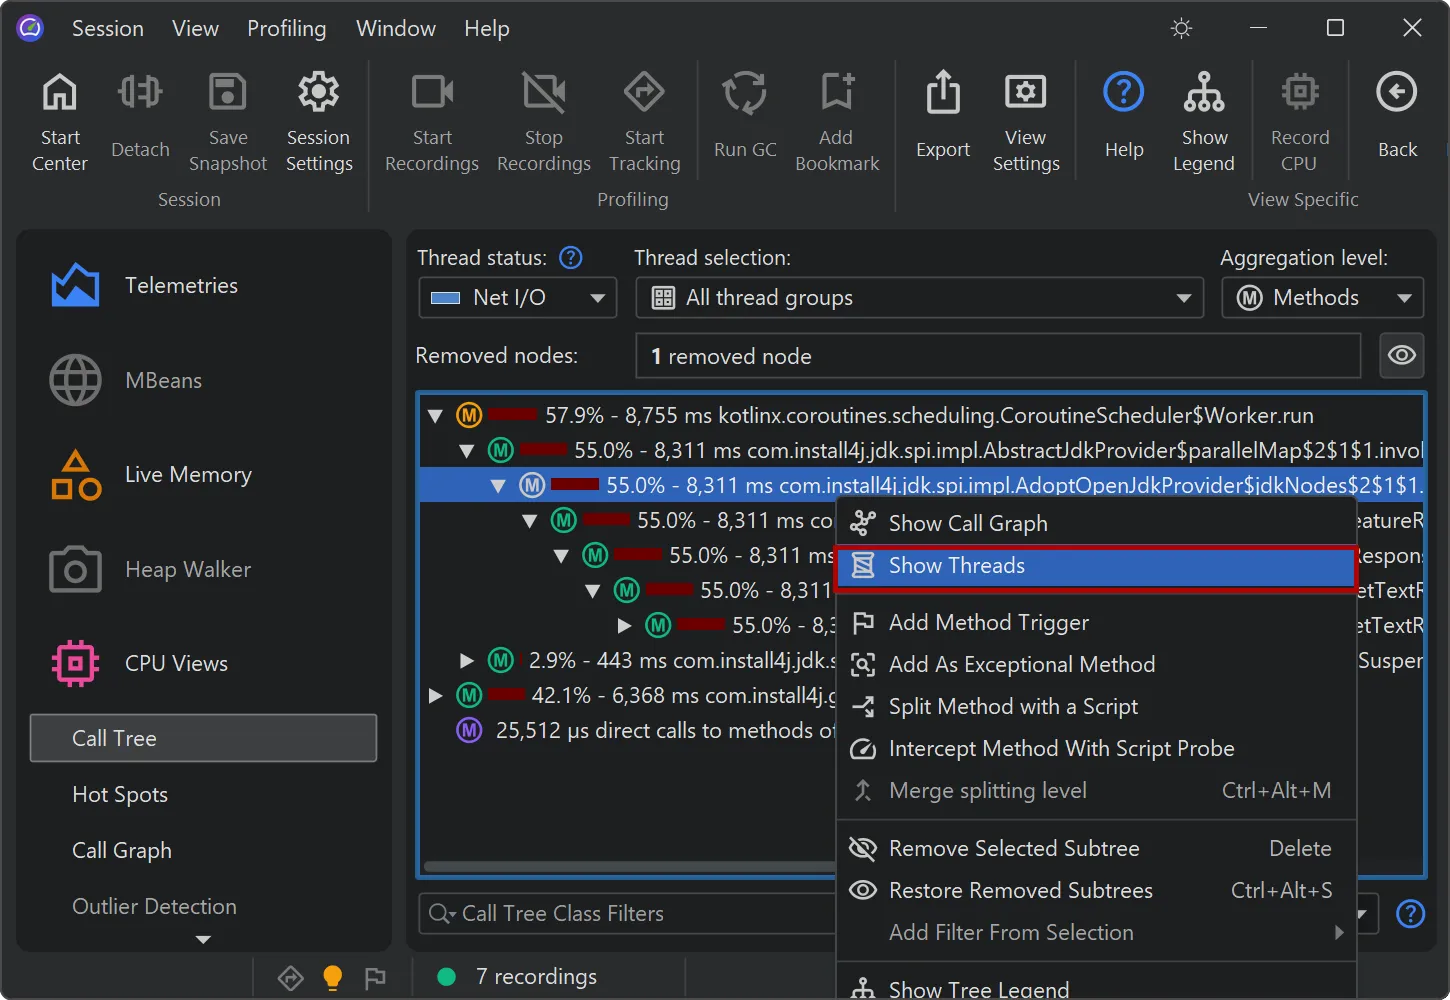
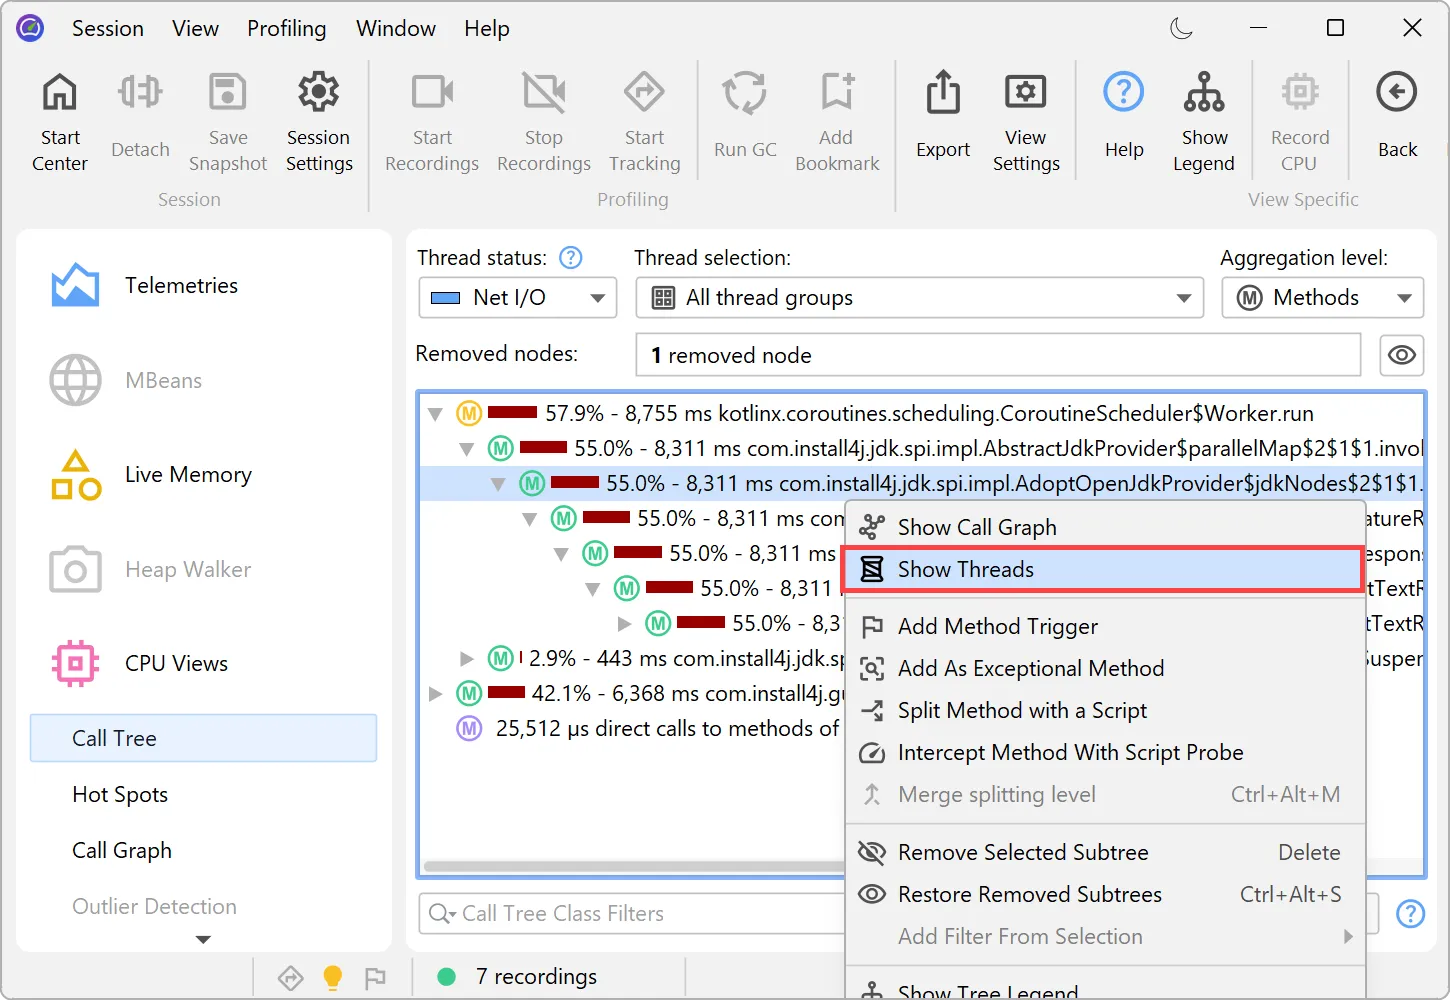
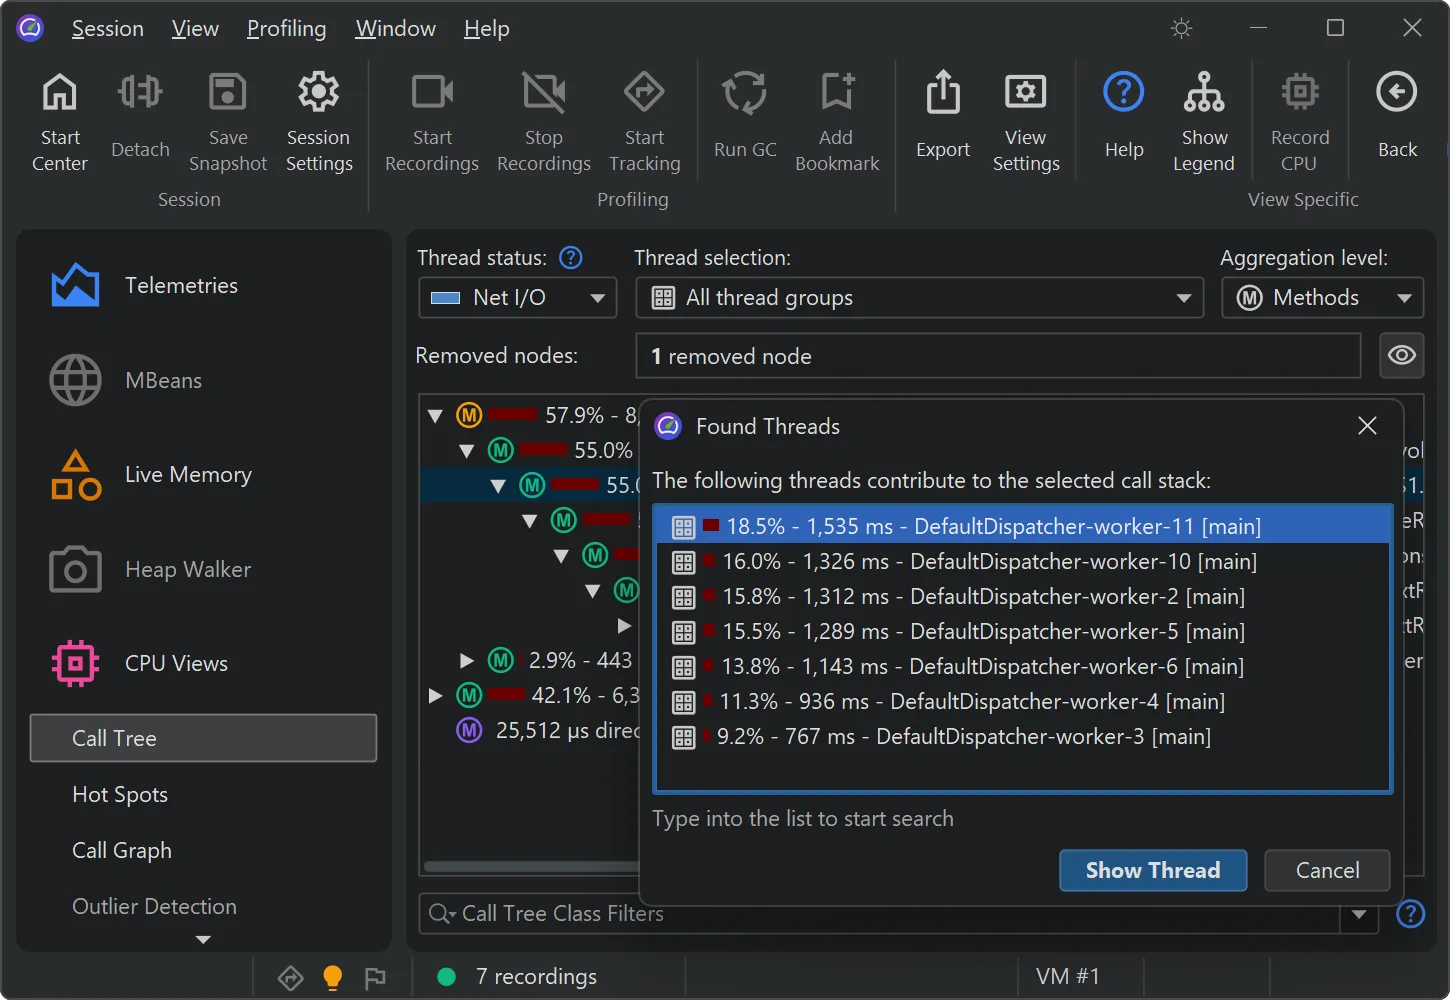
You can now analyze the contribution of single threads in a cumulative call tree. In the call tree view,
select "Show Threads" from the context menu to calculate this data for the selected node.
A separate dialog with a percentage breakdown of all contributing threads is shown. You can optionally select one thread
and switch to the call tree for that thread in the call tree view.
The feature helps identify thread-specific performance issues. For example, you may want to isolate a misbehaving thread from a thread pool.
The node detail dialog was improved in several ways.
The node detail dialog is an important tool to display more information for selected elements and is available from the "View" menu or
the context menu.
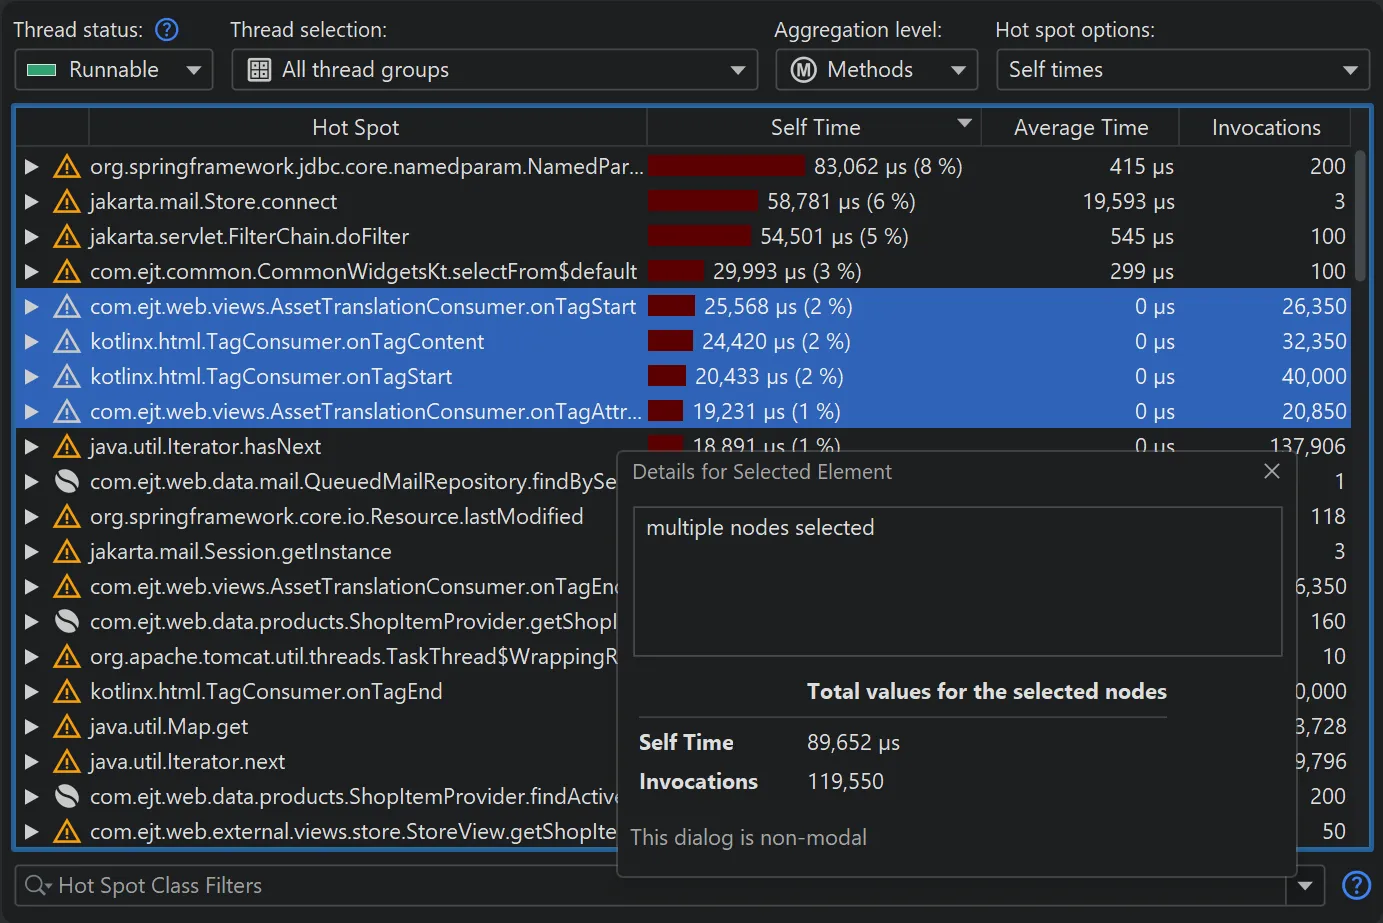
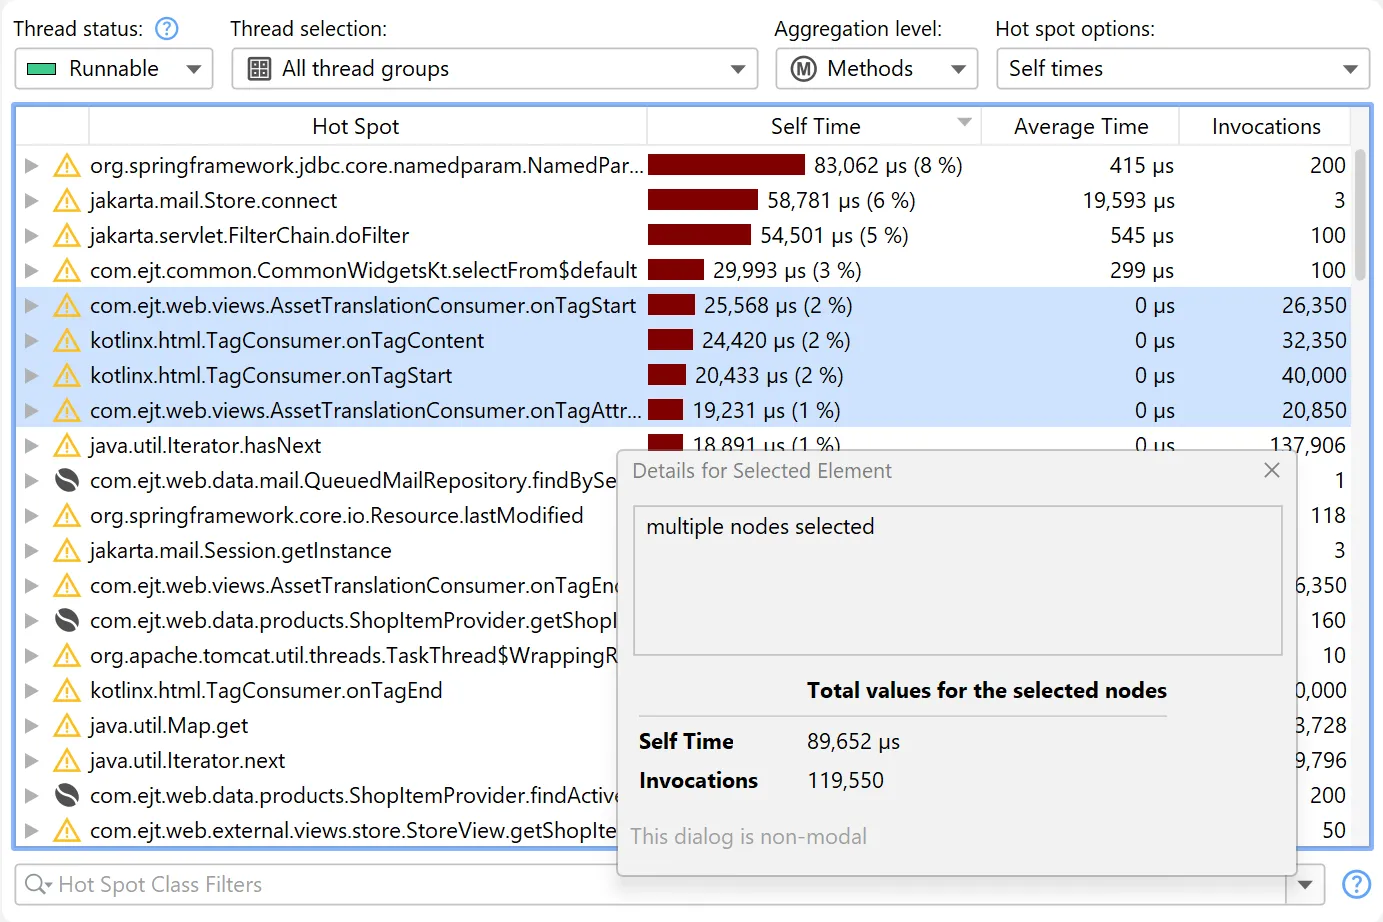
When selecting multiple nodes in hot spots views, cumulative statistics for the selection are now displayed.
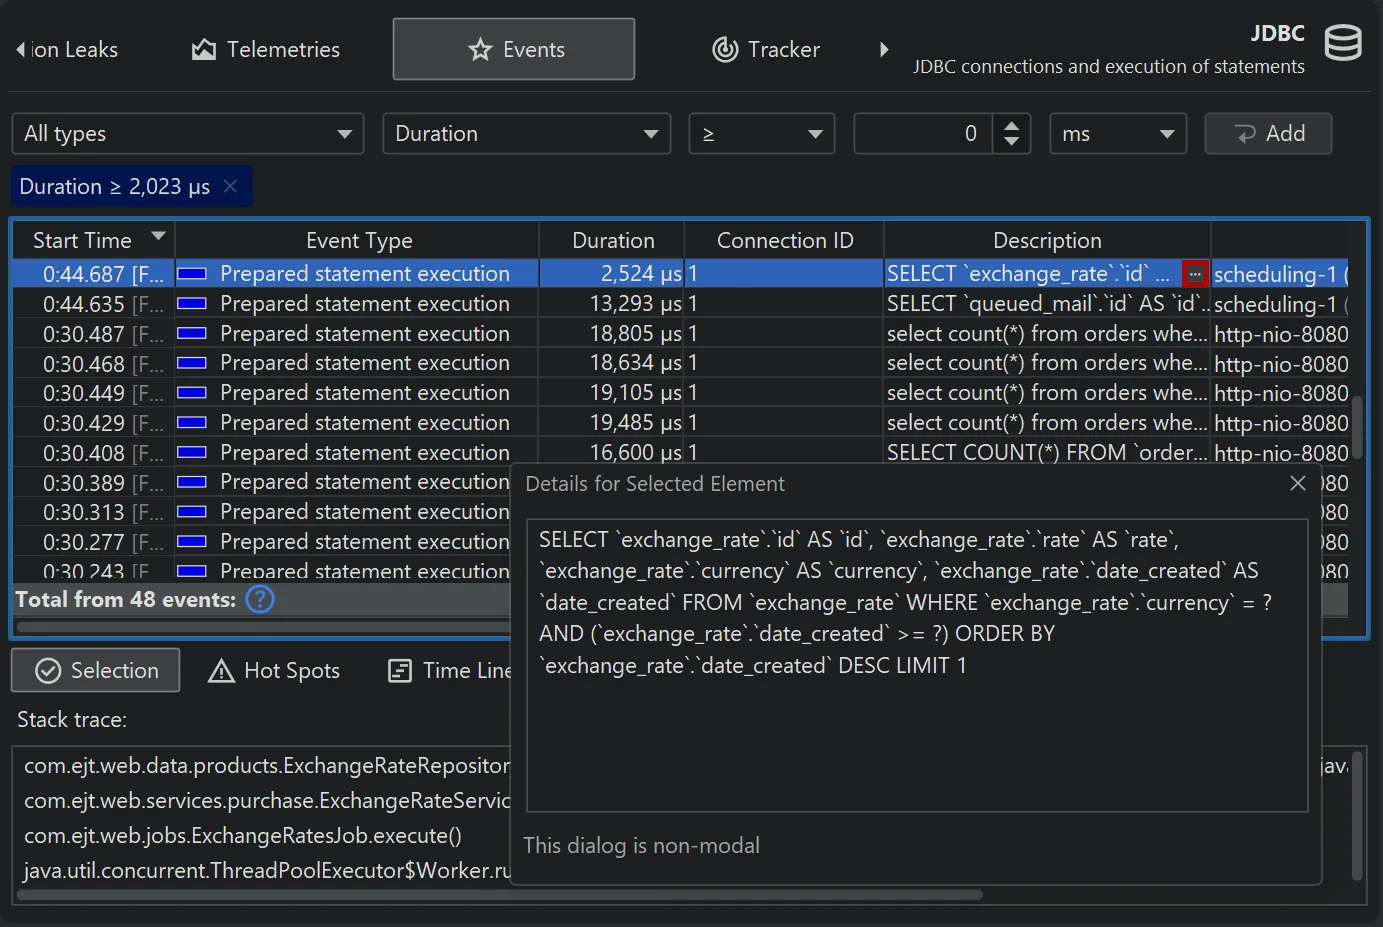
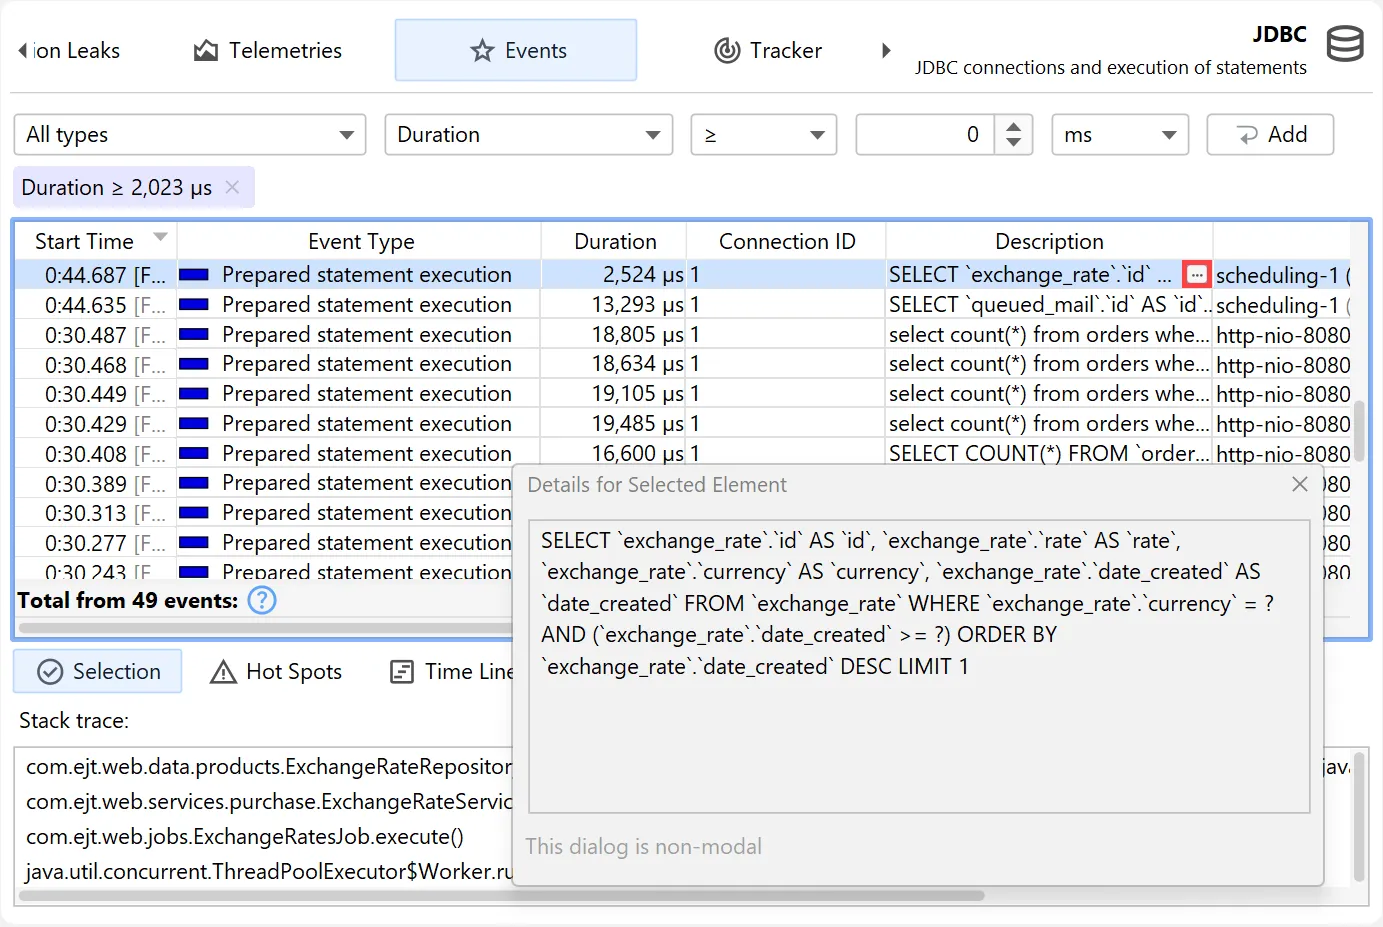
Many tables in JProfiler have columns containing long text that exceeds the column width. The node detail dialog
shows the complete text in this case. Starting with JProfiler 16, there is a hover button that directly opens the node detail dialog and activates
the correct tab if there are multiple long text columns in the table.
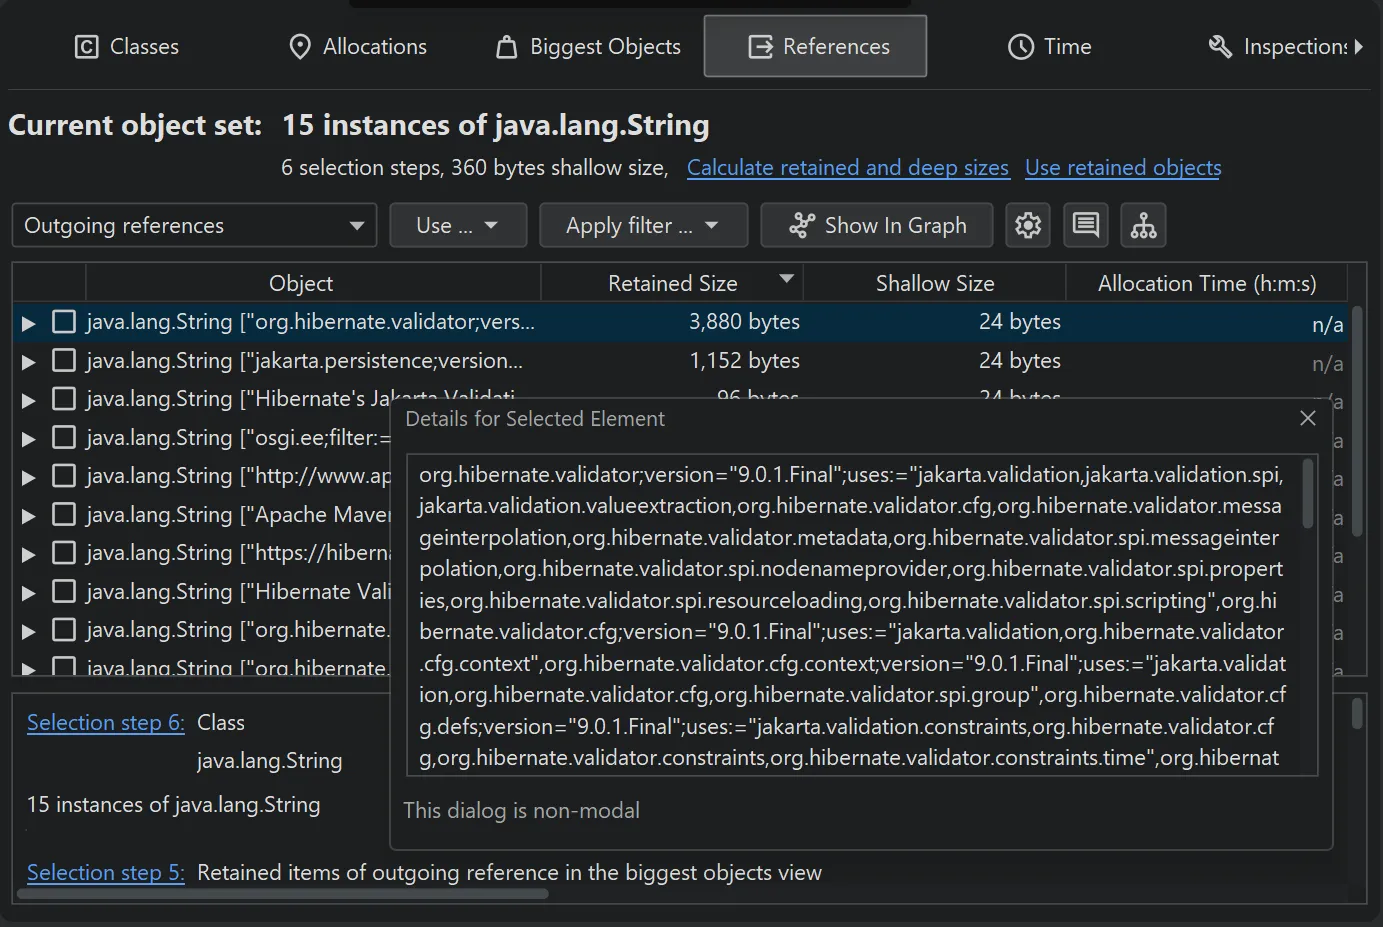
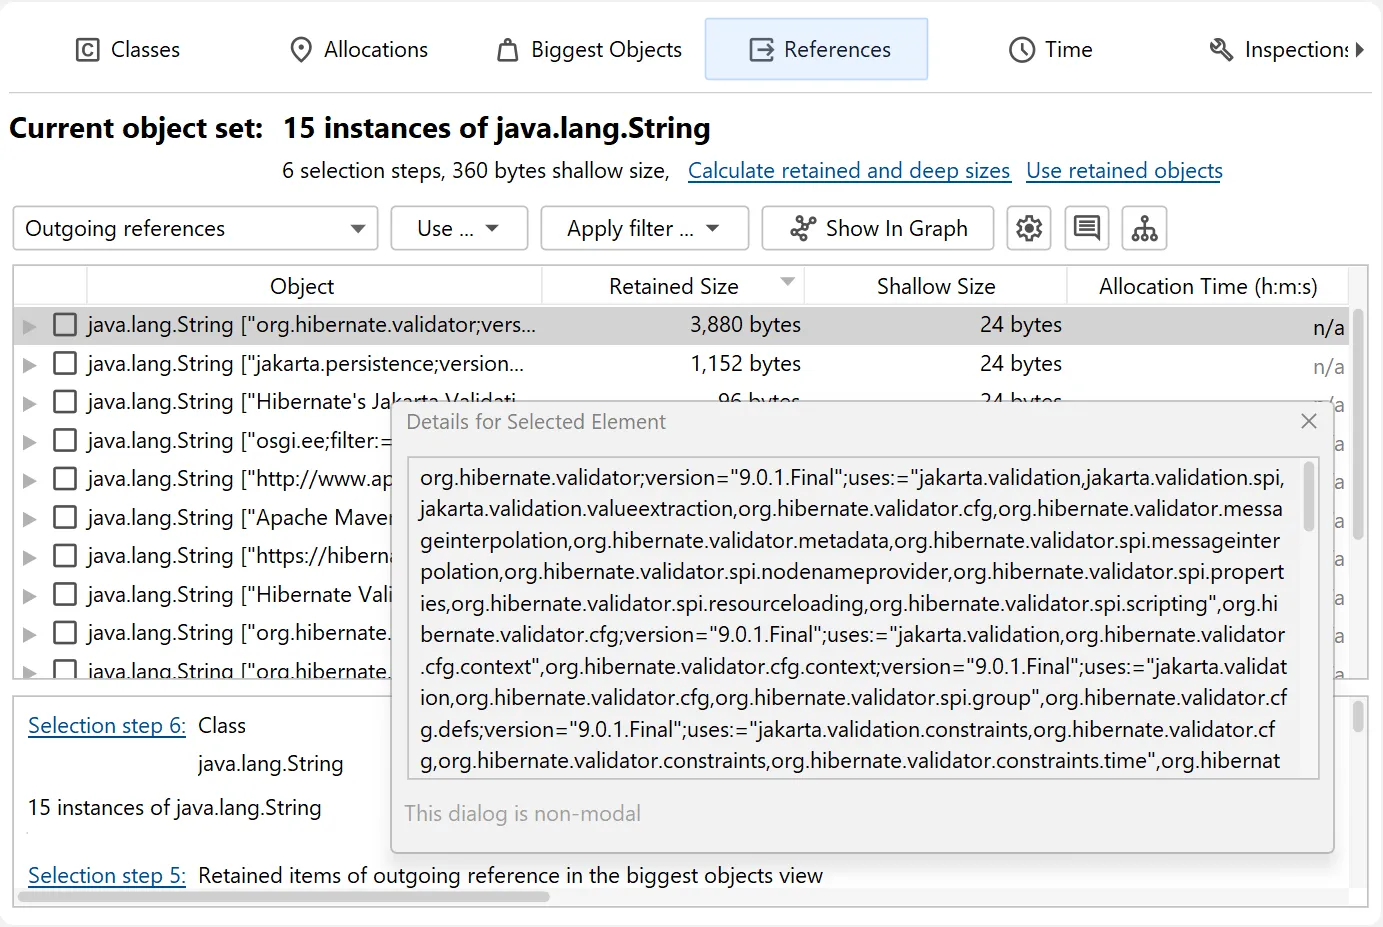
In the heap walker, the node detail dialog now shows the full values for string values in the reference views, not just the displayed
truncated preview string.
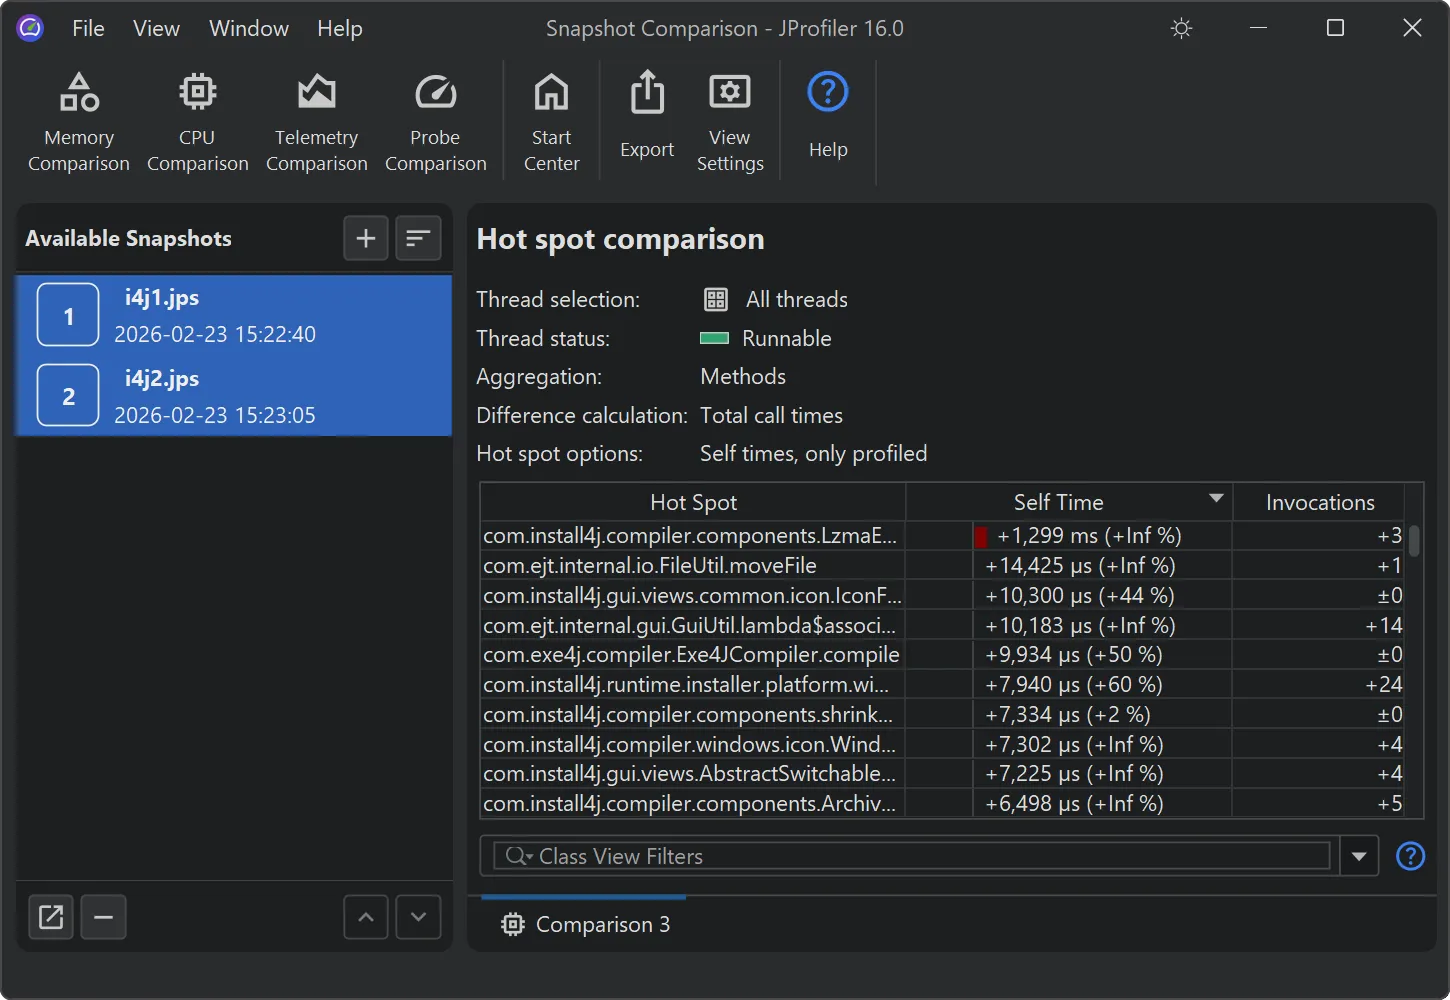
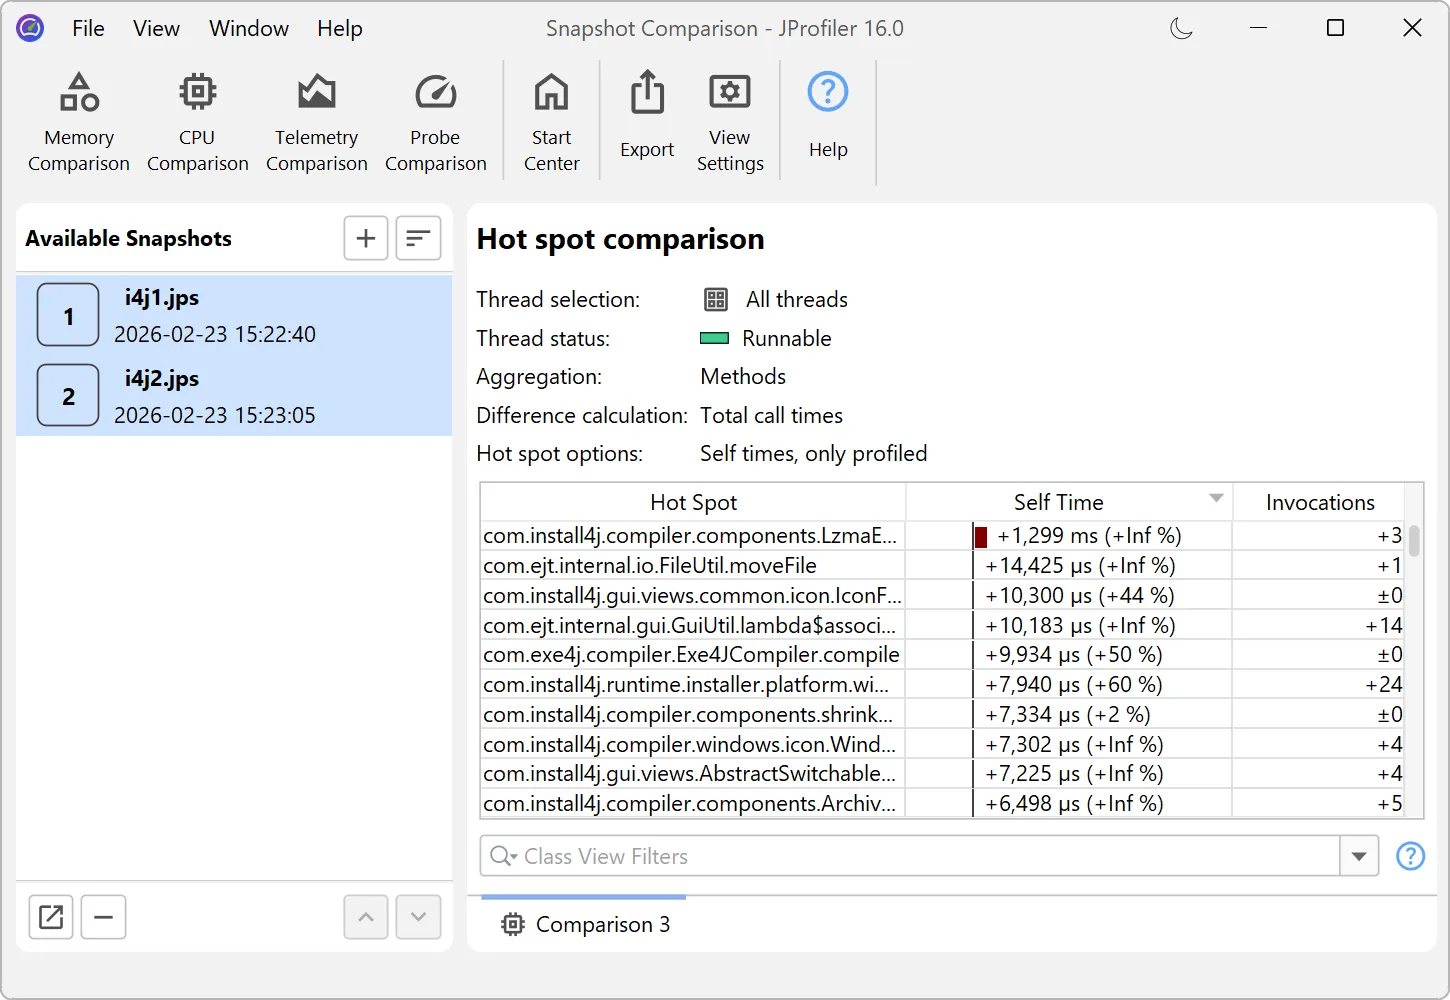
JProfiler now supports deobfuscation for snapshot comparisons.
Previously, when comparing snapshots from an obfuscated application, there was no way to deobfuscate classes and methods.
Below, you can see an example of a comparison using obfuscated names.
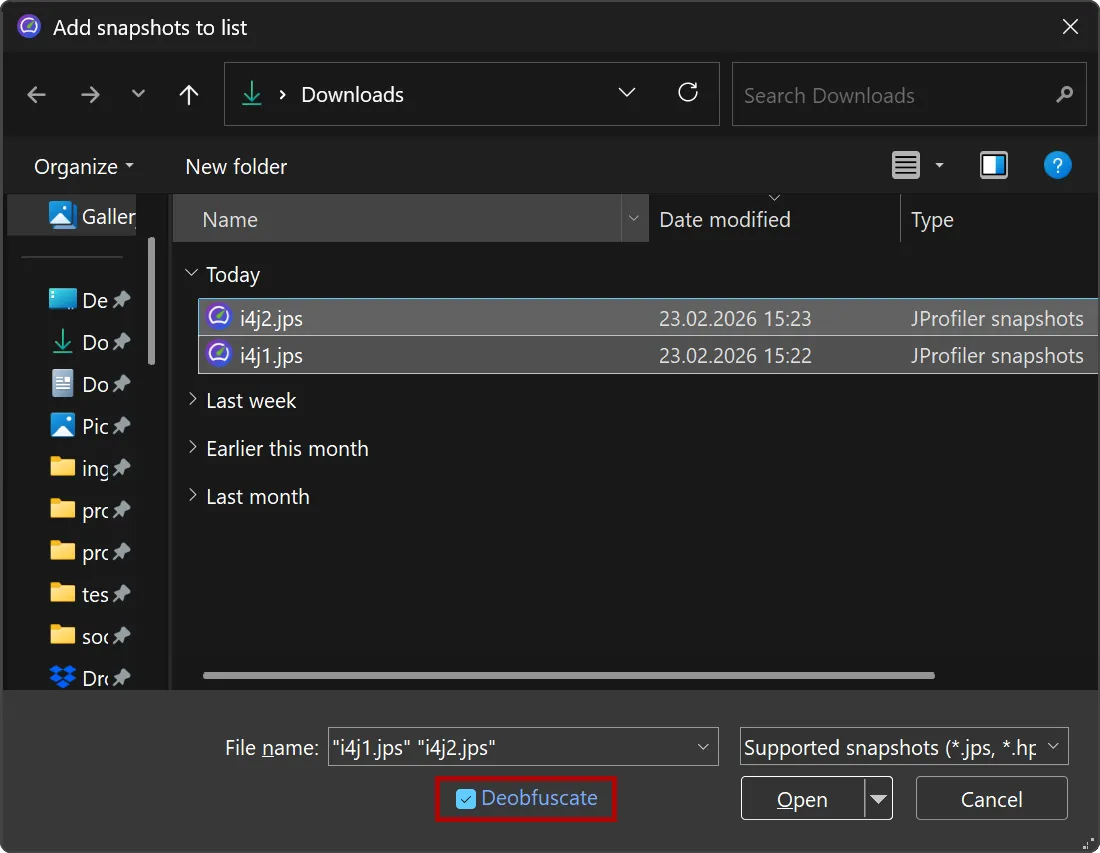
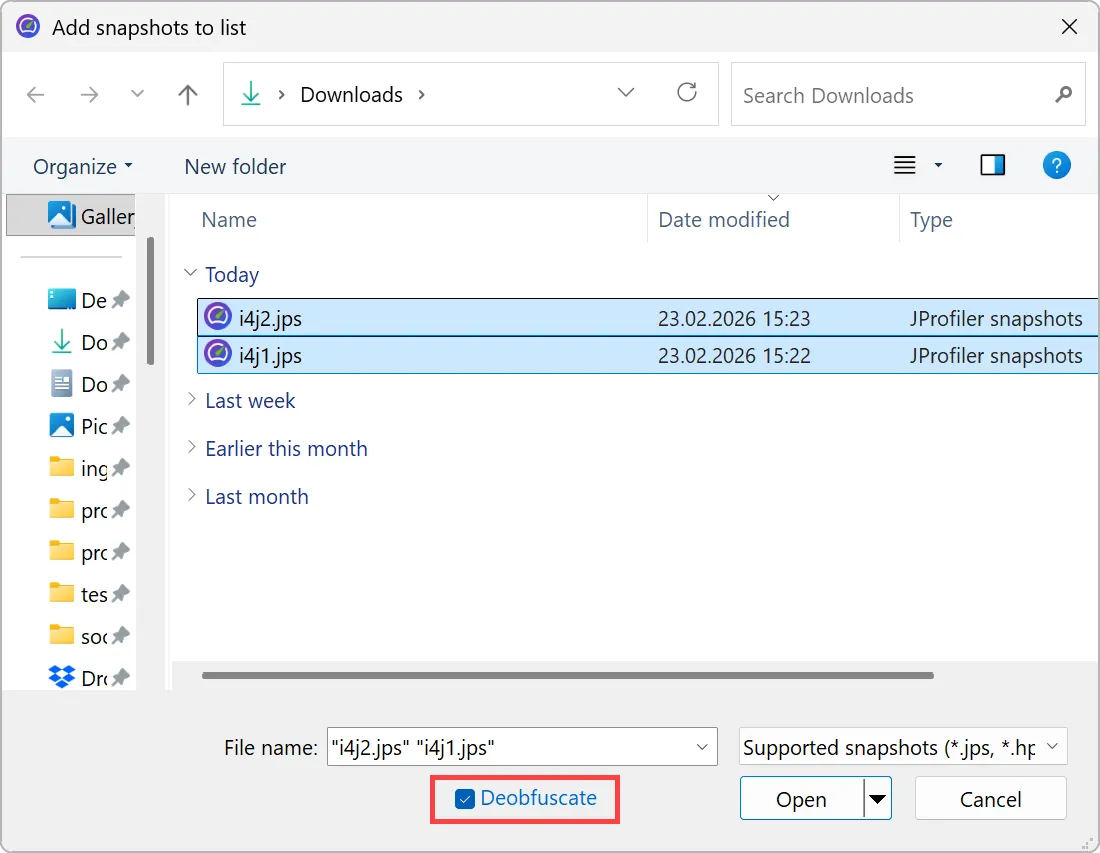
Similar to the existing deobfuscation support when opening snapshots, the file chooser now includes a "Deobfuscate" check box when
adding snapshots to the comparison window.
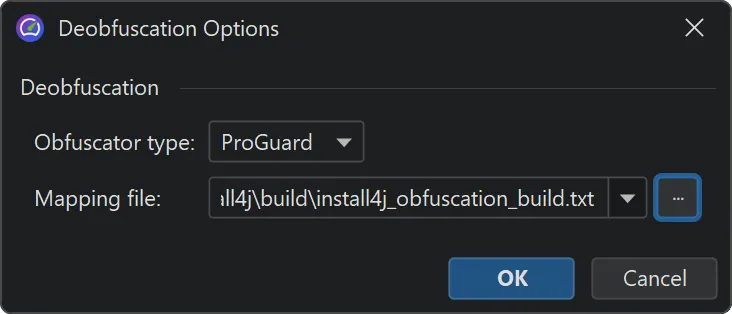
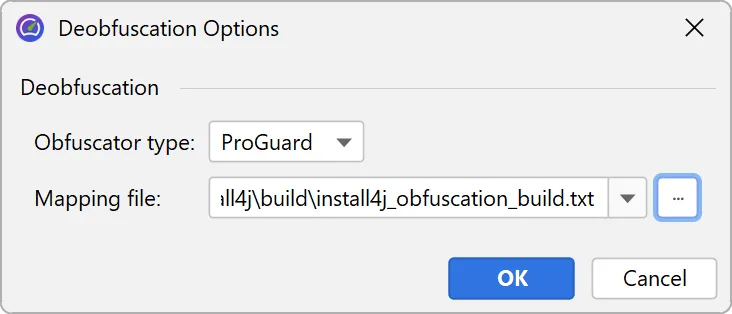
When selected, a dialog with a drop-down for supported obfuscators and a field for the mapping file path appears.
If different snapshot files have different mapping files, you can add the snapshots individually.
Once the mapping file is applied, all comparisons in JProfiler now show the original class and method names.
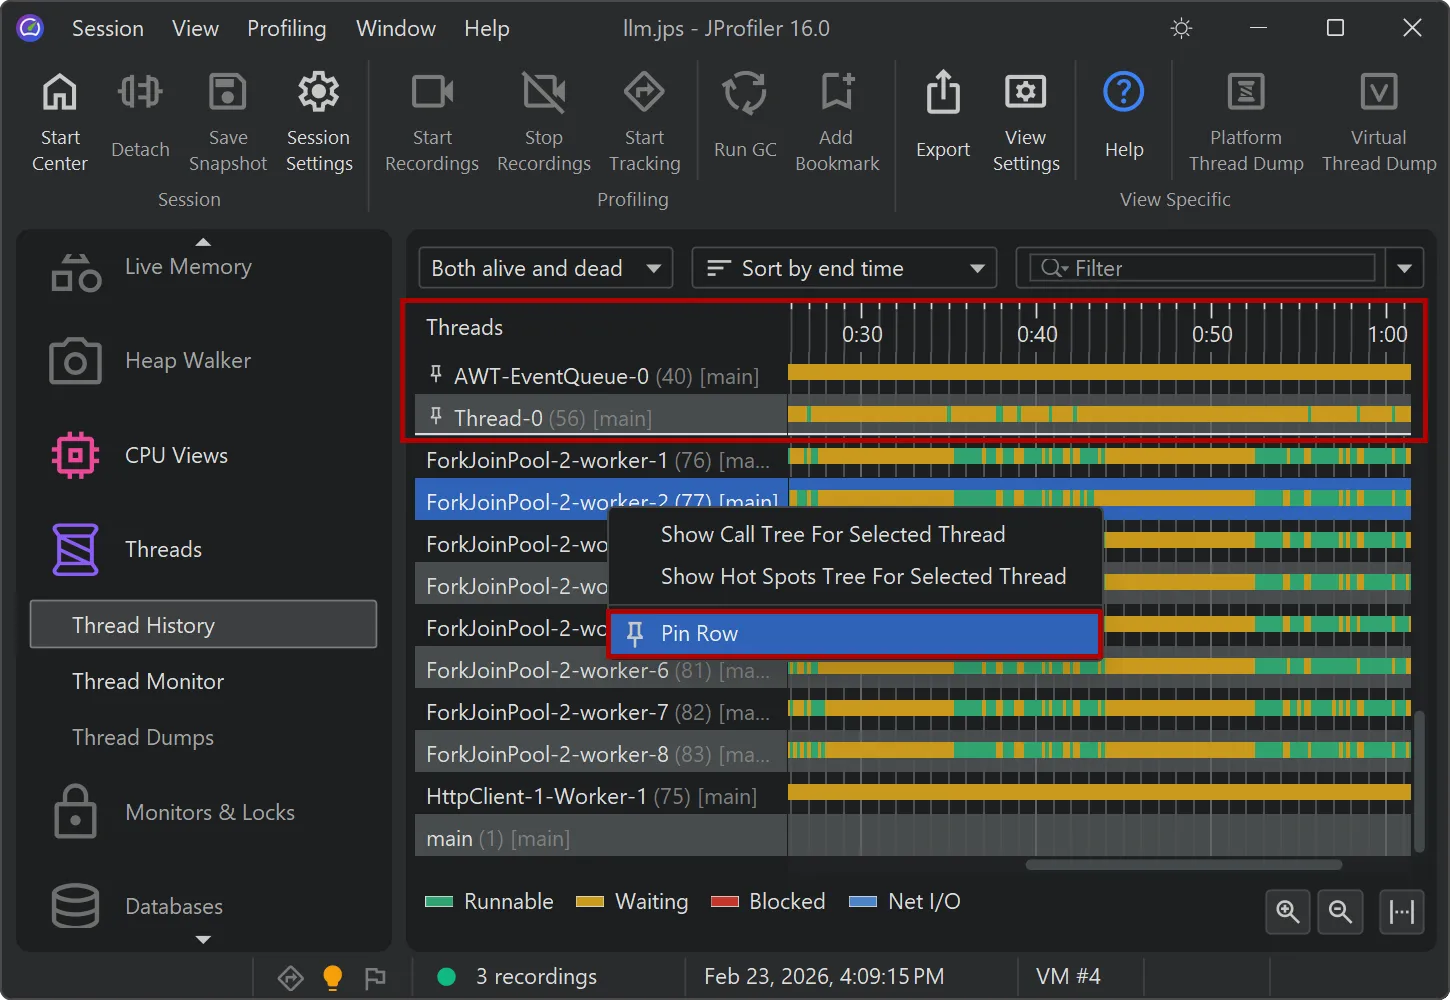
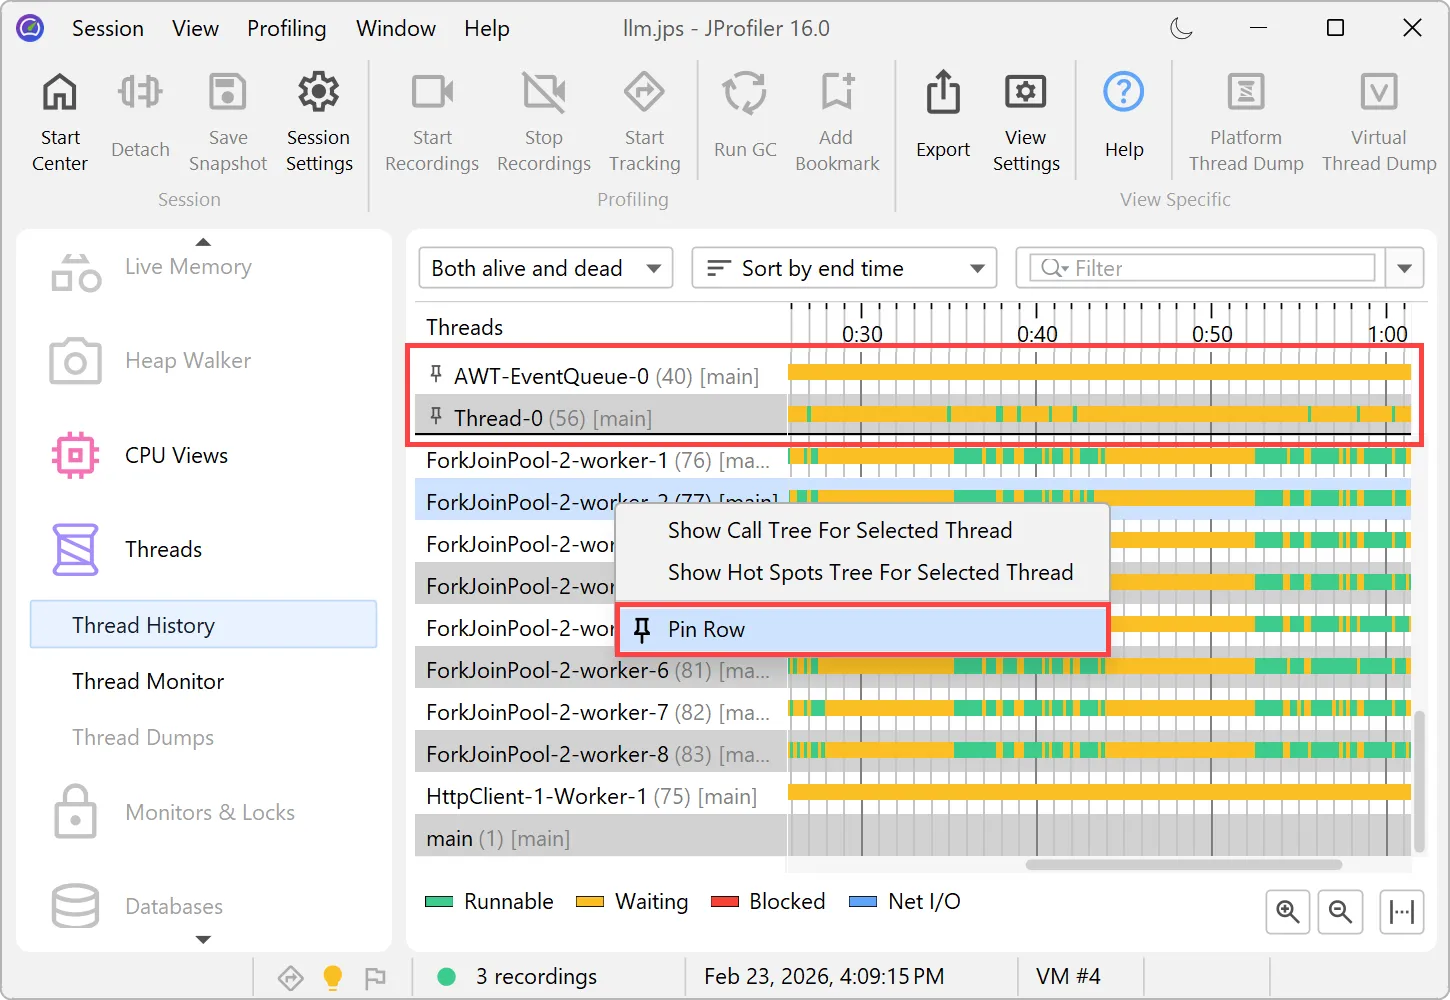
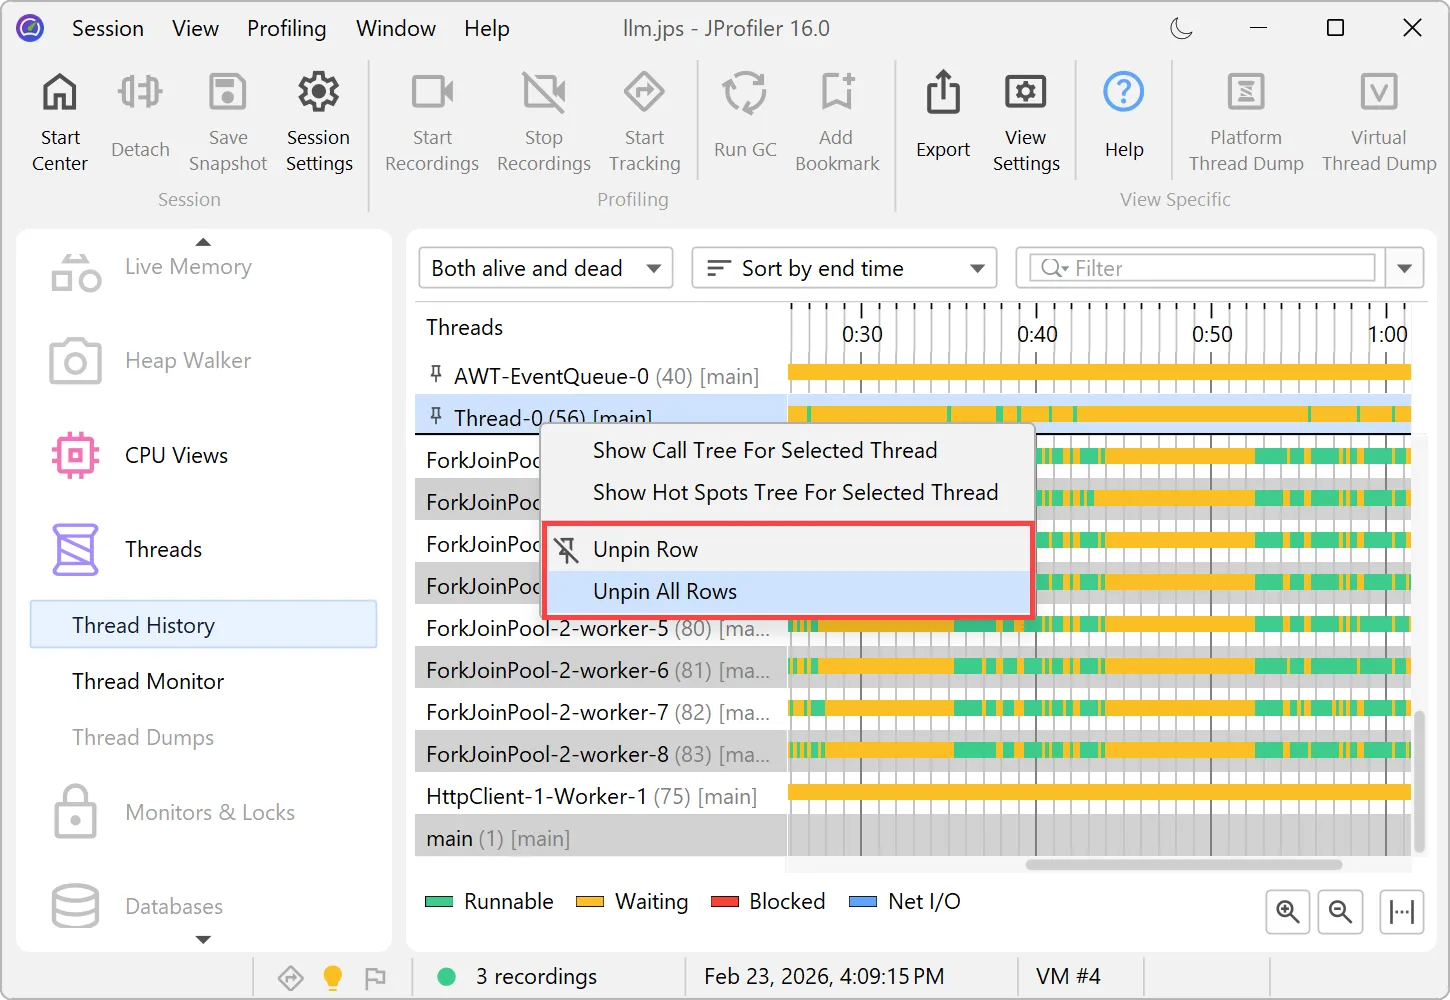
Timeline views now support row pinning.
In the threads history view and in all the probe timeline views, you can pin selected rows via the context menu. These are shown
in a separate area at the top where you can use drag and drop to change their order.
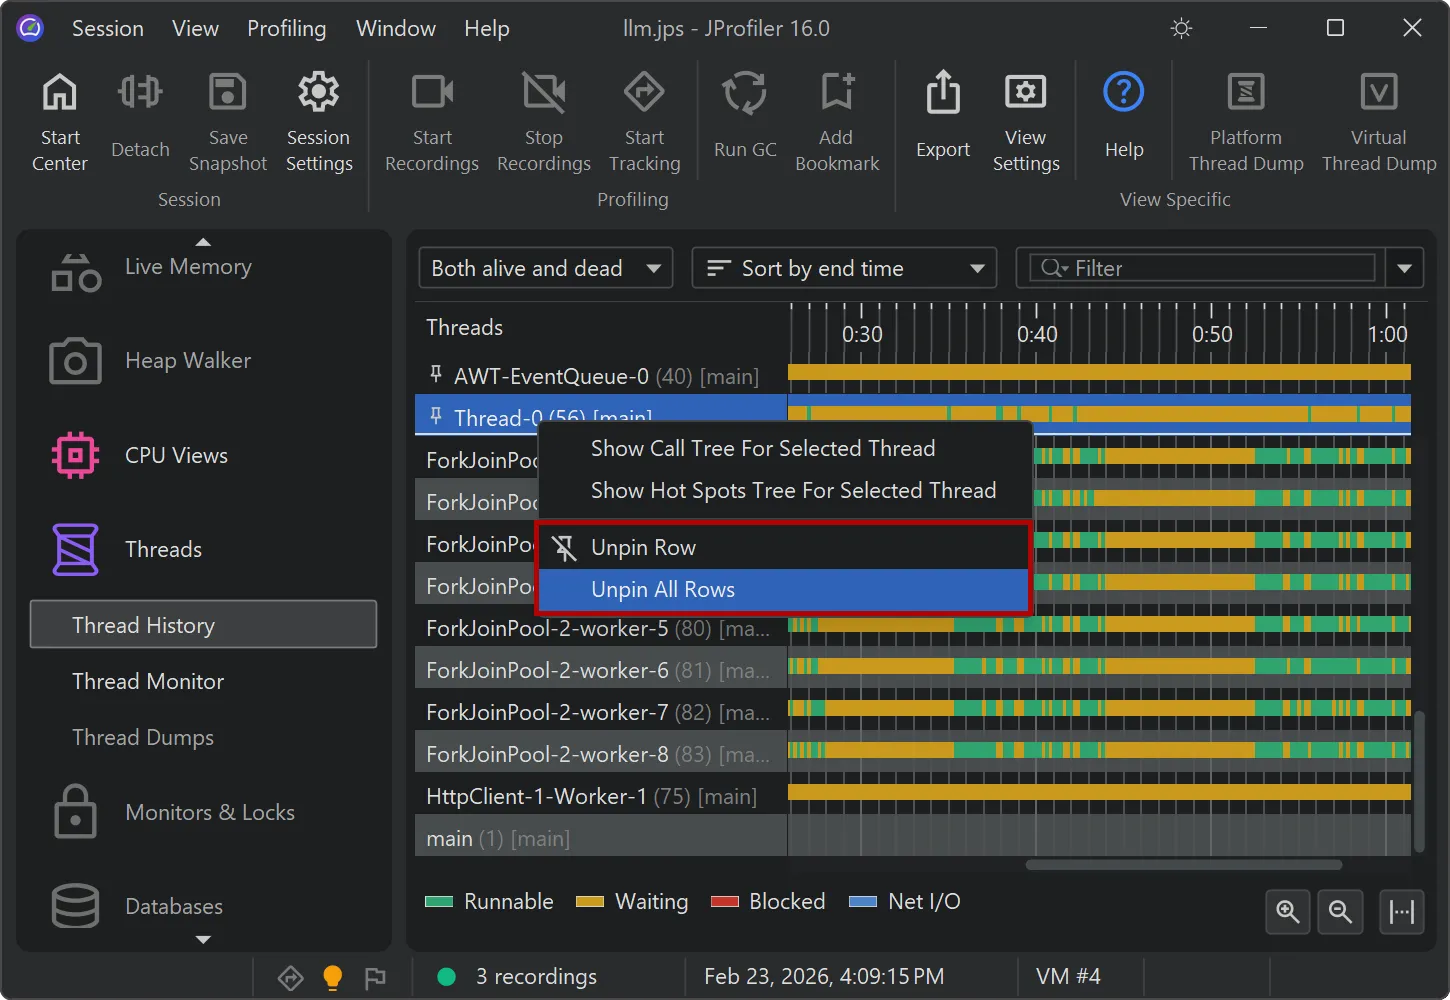
You can unpin pinned rows individually or all at once.
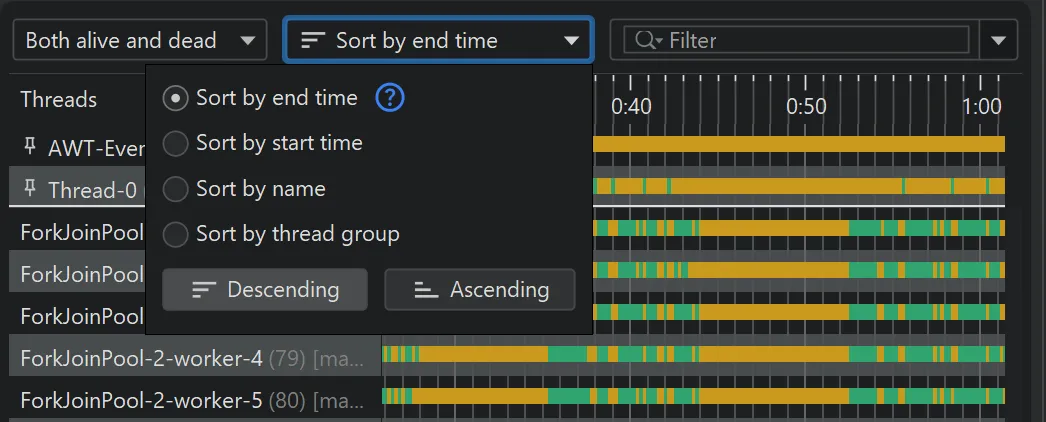
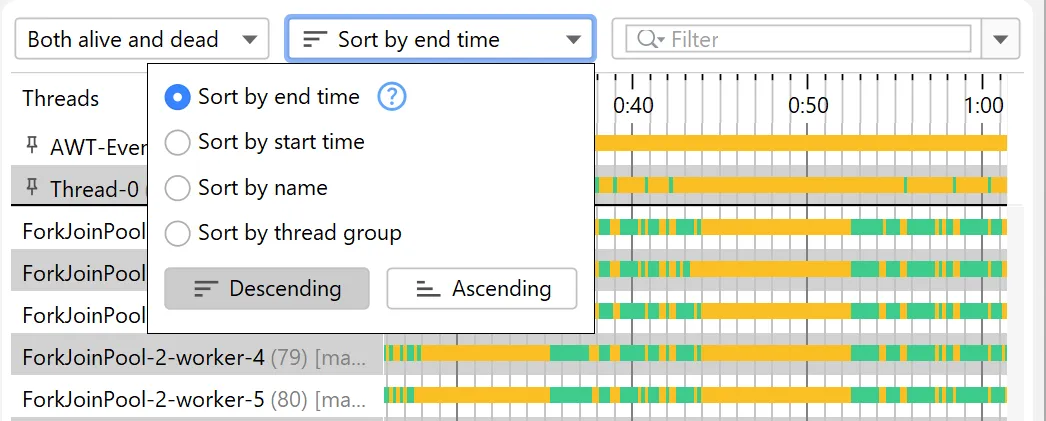
JProfiler 16 also introduces a sorting drop-down that offers ascending and descending sort directions and a new default sort mode
where active long-lived rows are shown first, followed by recently closed rows.
JProfiler 16 adds full support for profiling Java 26.
This version is essential if you are profiling virtual threads or if you are using the new built-in HTTP/3 support in the JDK HTTP client.
Probes for Apache Kafka were added. The probes measure various types of data that help you to identify
bottlenecks, optimize configurations, and maintain the health of your data streaming infrastructure.
To handle both client and server separately, there are separate probes for Kafka consumers and Kafka producers.
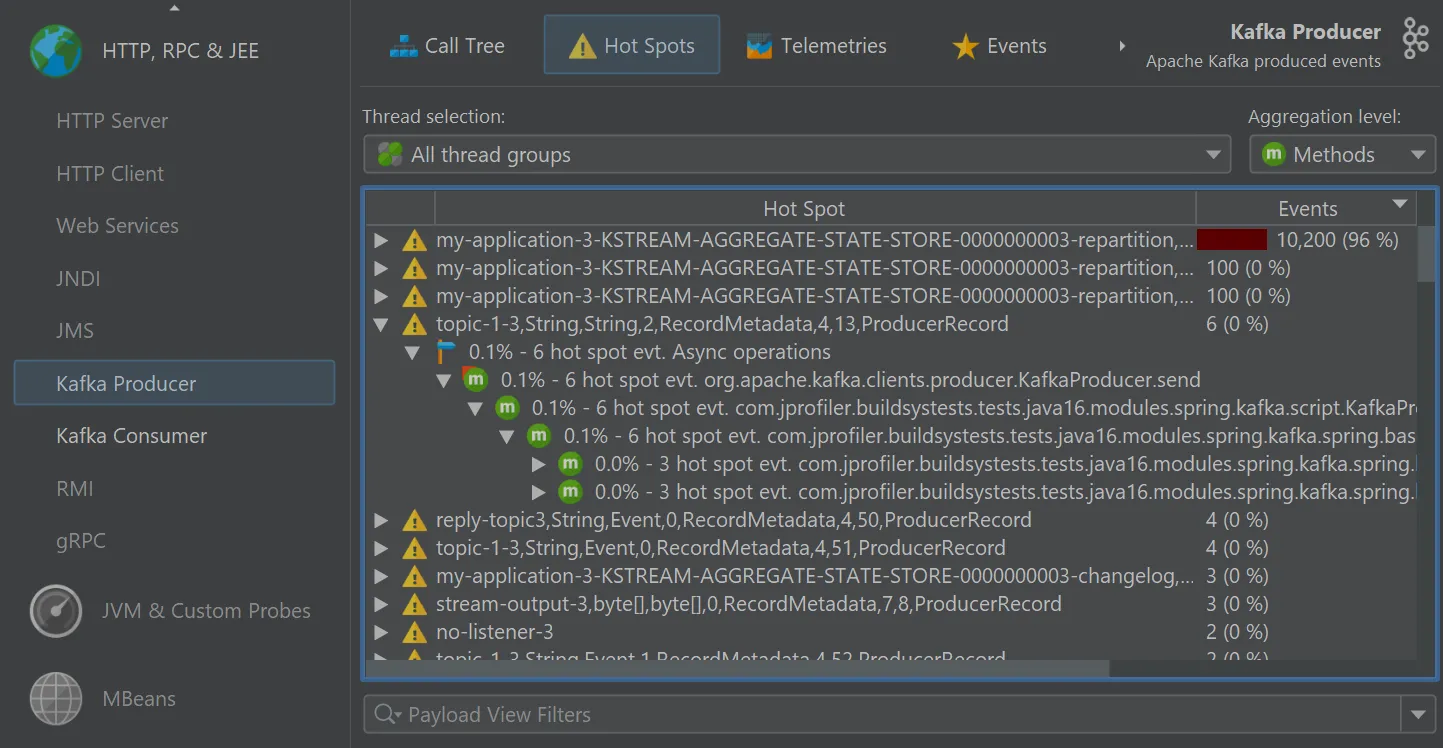
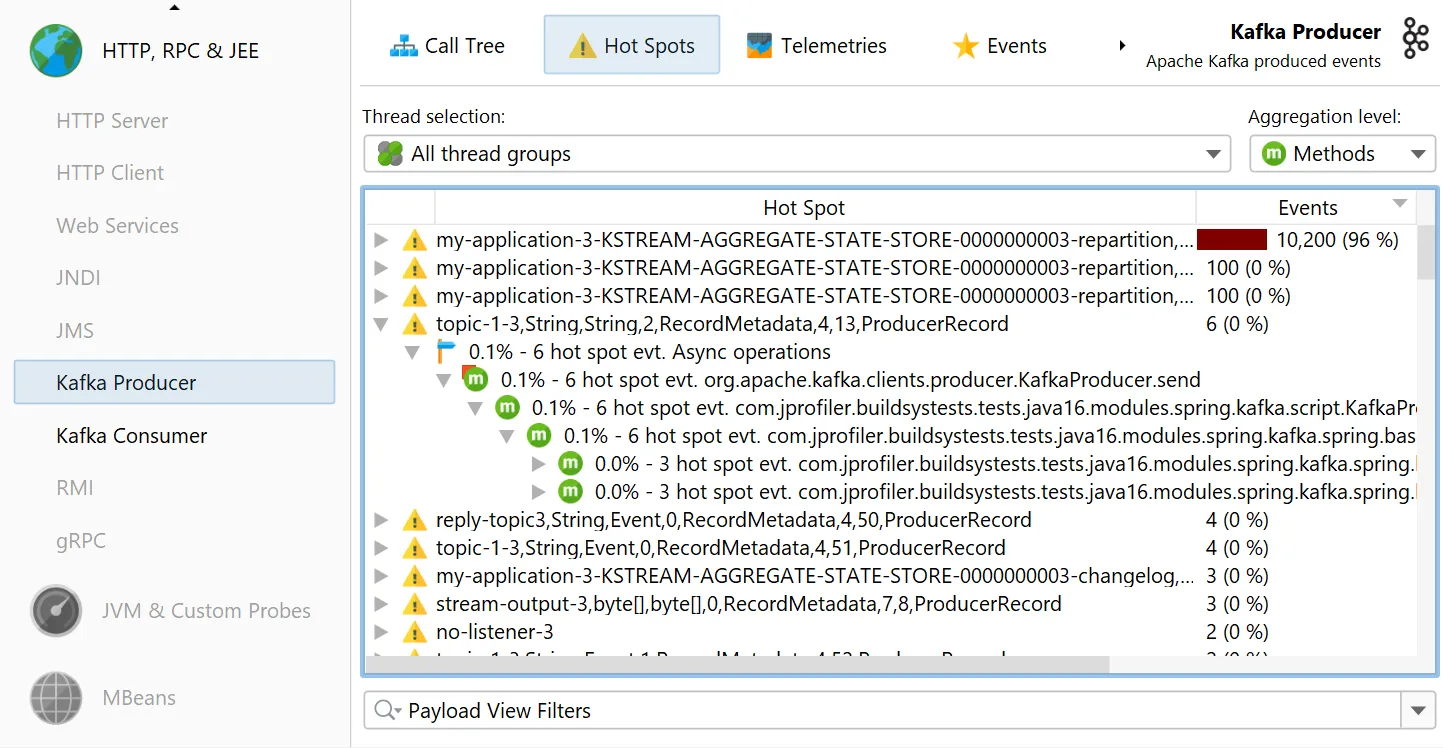
The "Kafka producer" probe analyzes the events that you publish.
A starting point for handling many kinds of problems is the "Hot spots" view where you can open hot spot nodes to see the back traces
into your code.
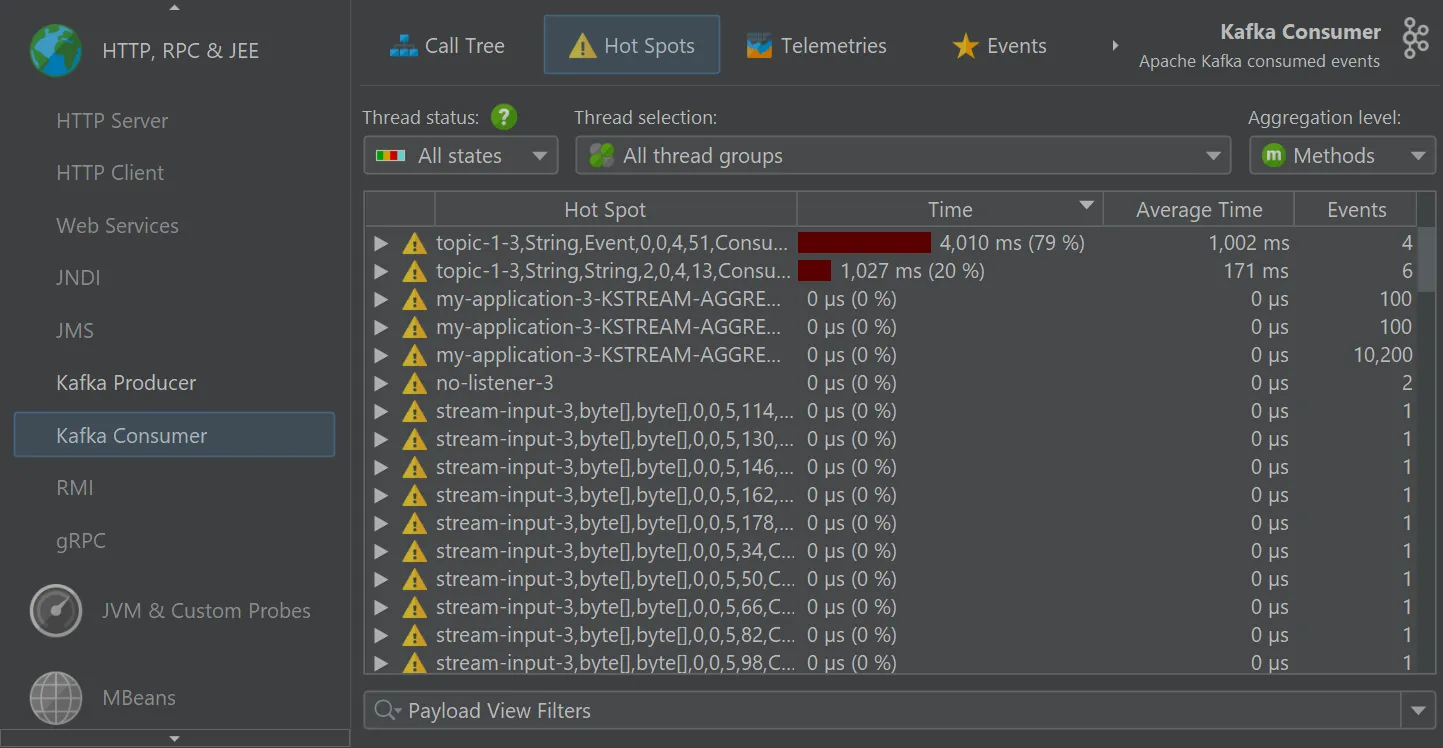
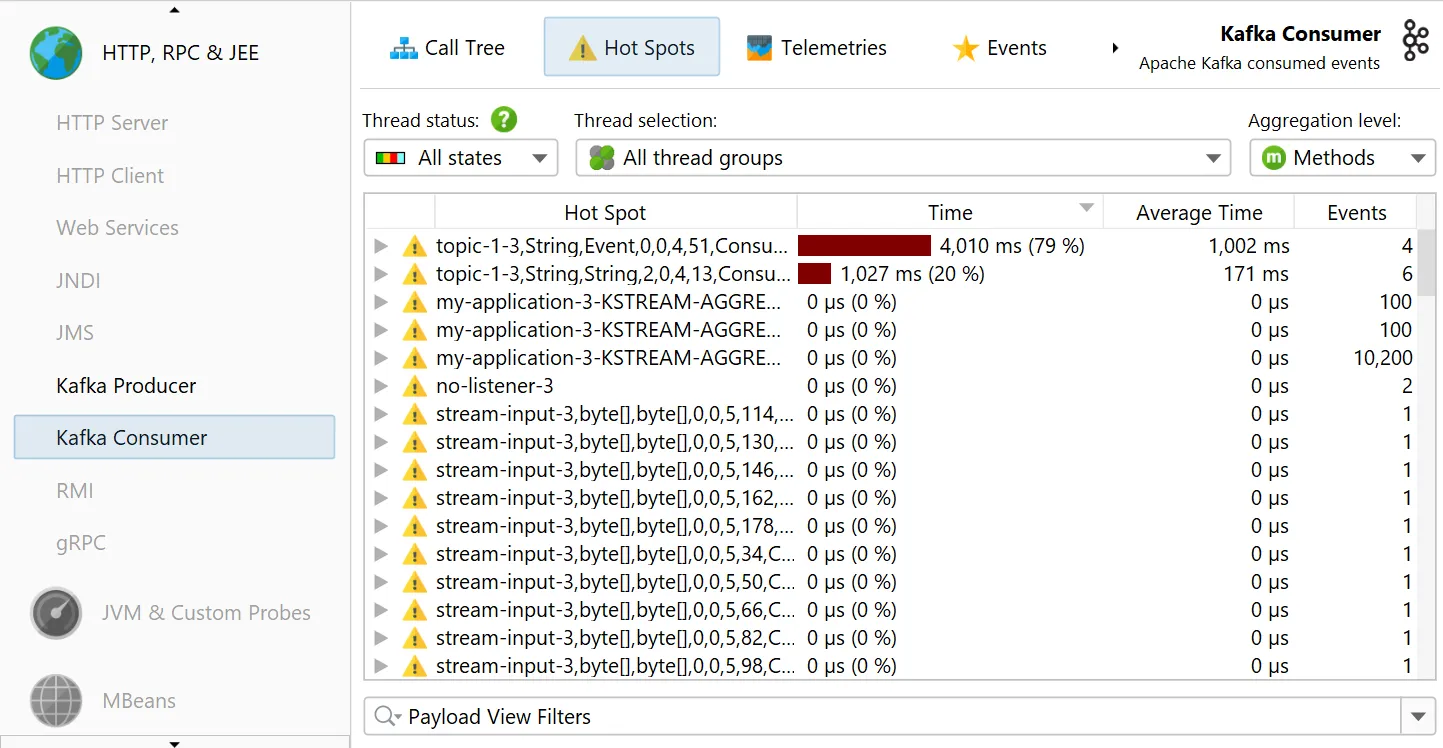
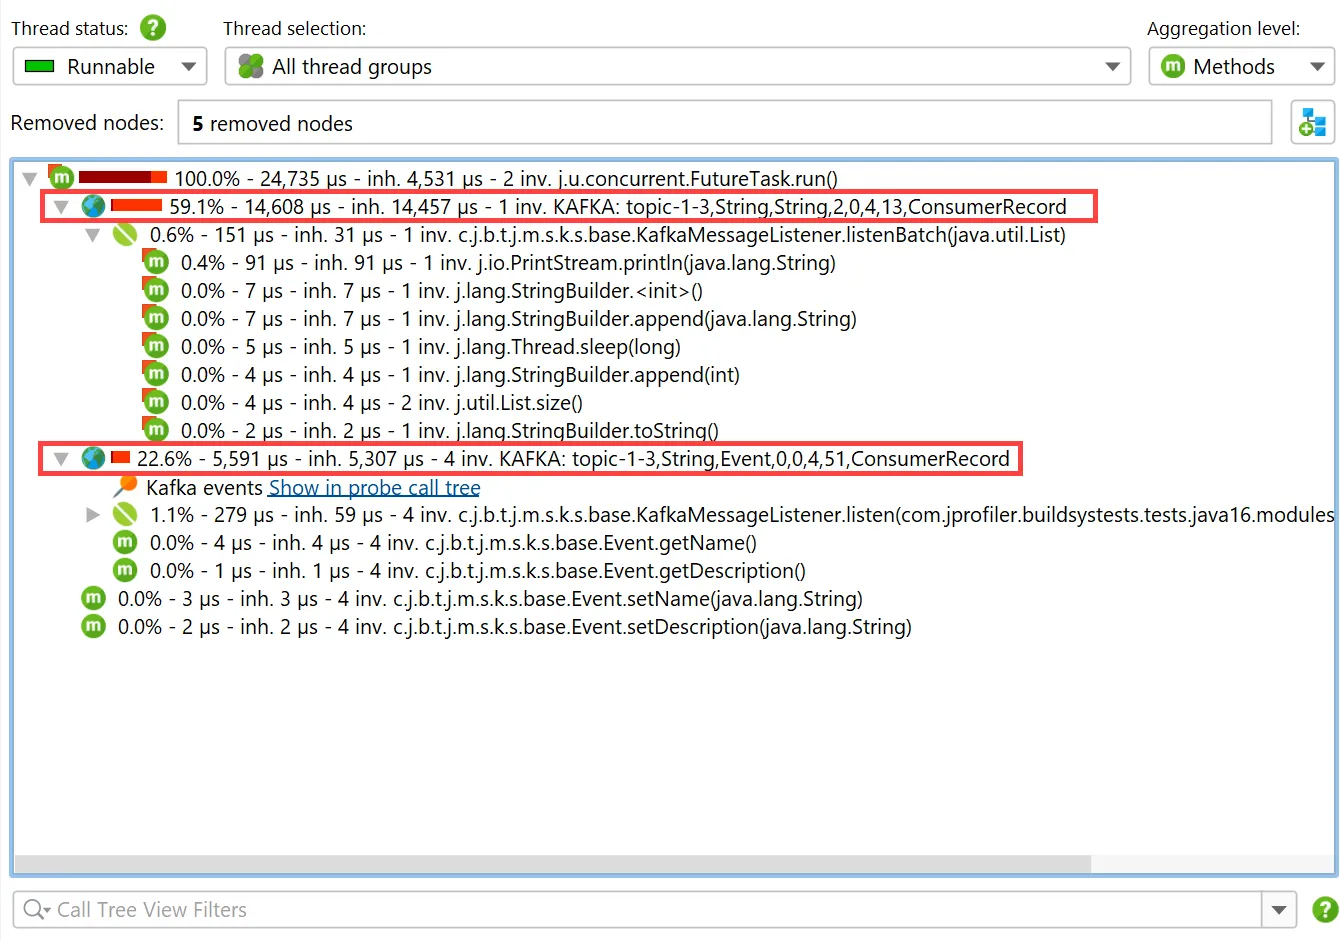
The "Kafka consumer" probe measures the events that you process. For Spring Kafka, event timings are recorded.
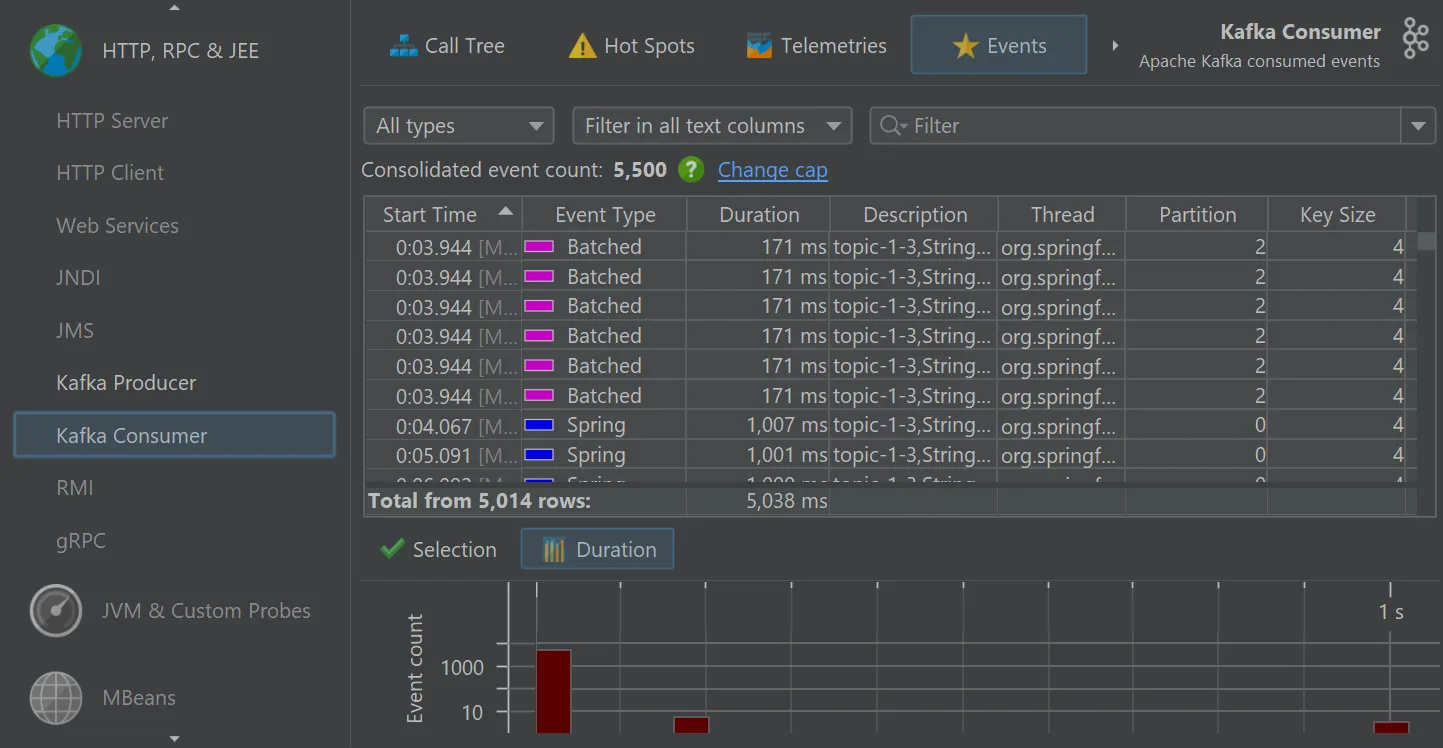
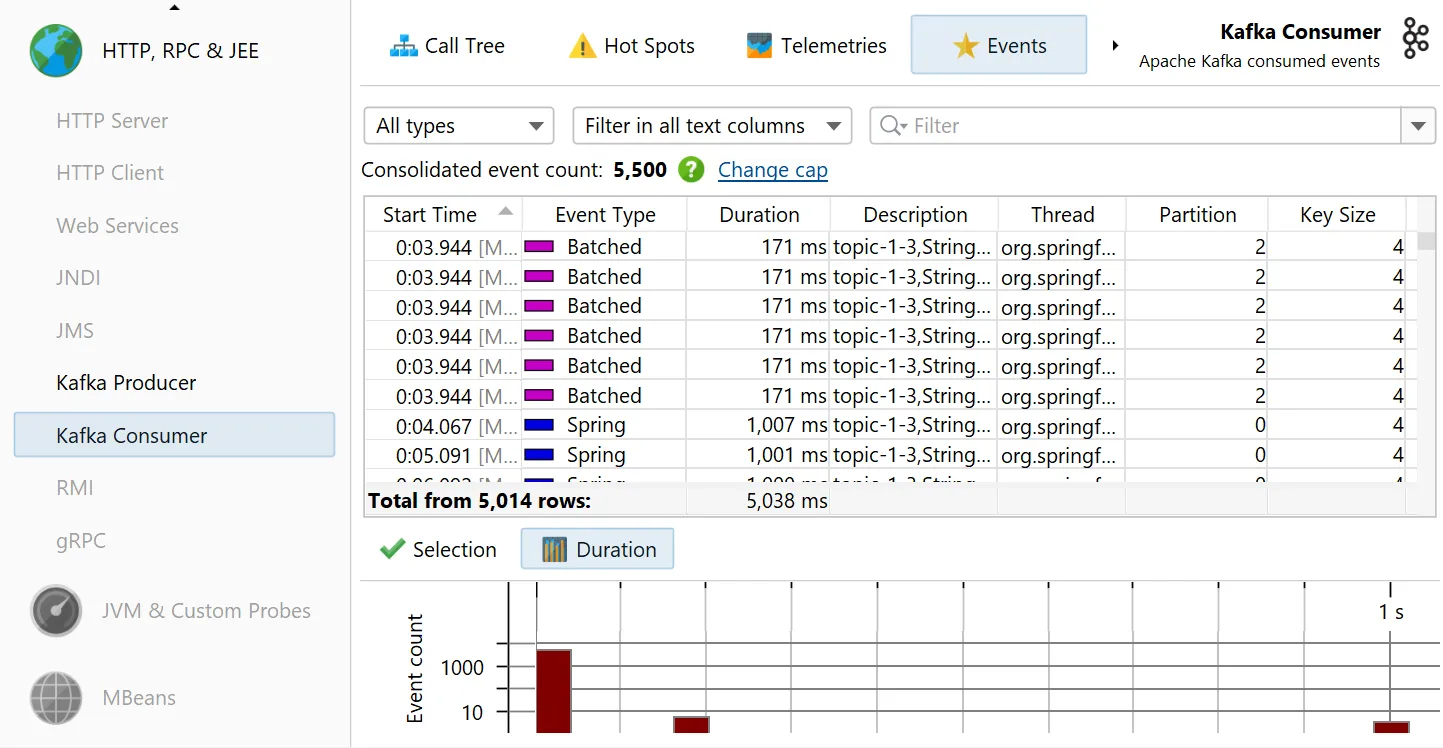
Single events can be analyzed in the "Events" view, where values for event type, thread name, partition, key and value size are also shown.
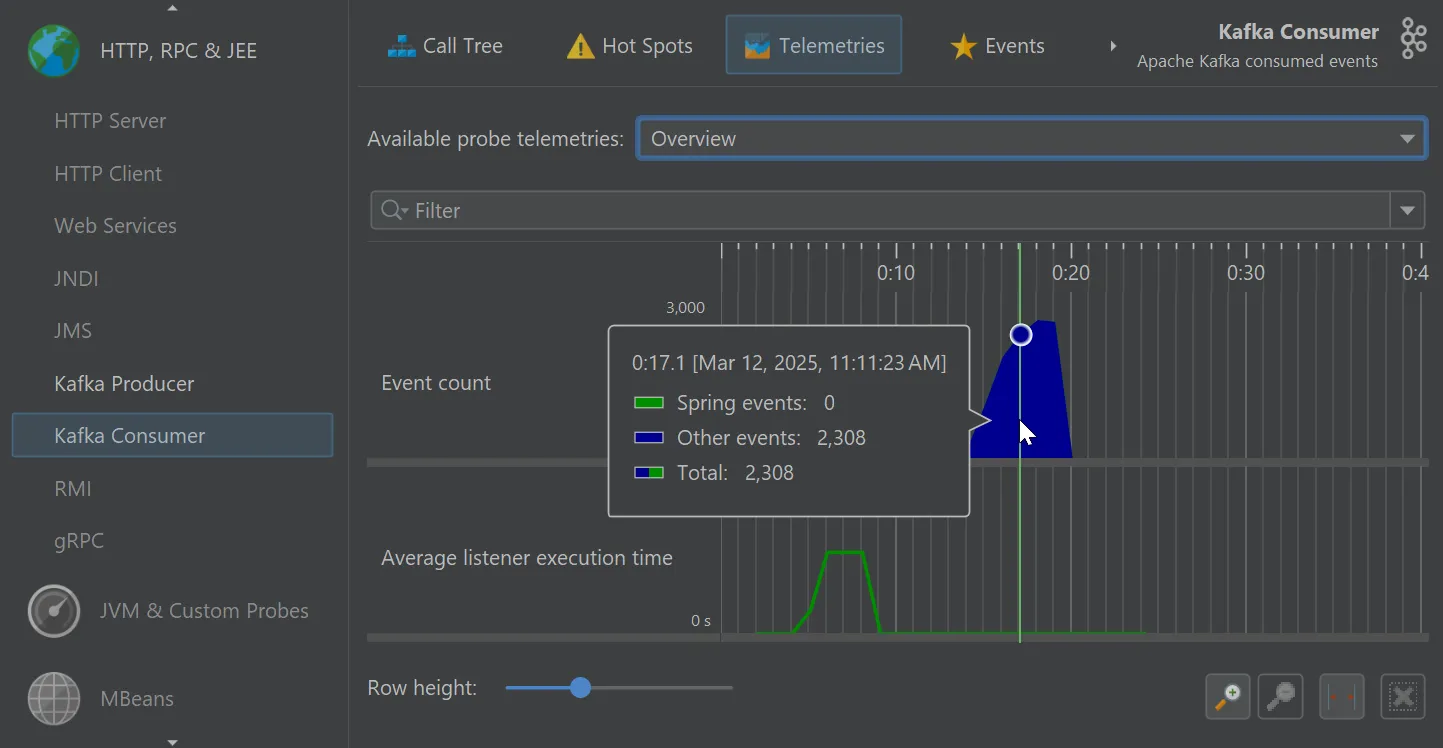
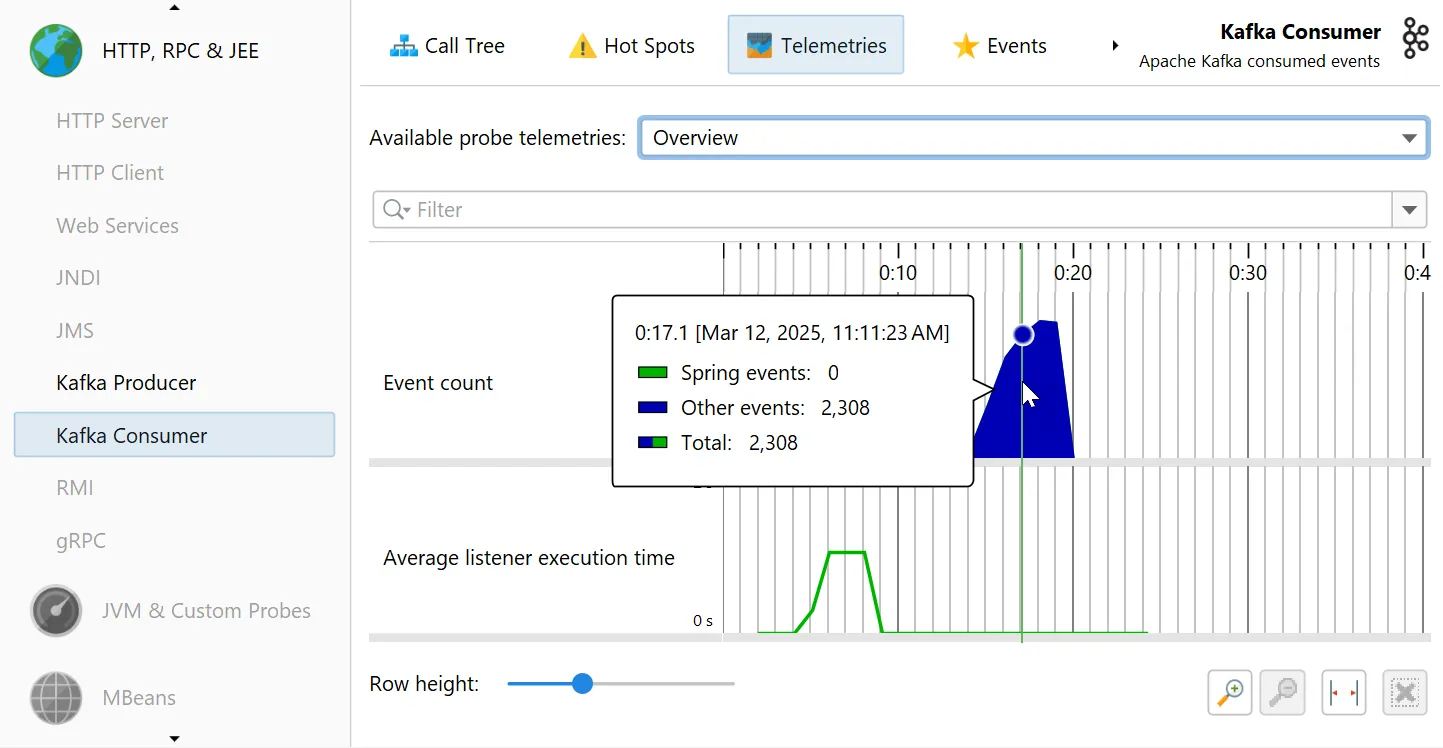
The Kafka probes contribute several telemetries, like "Event count" and "Average listener execution time" that can also be added
in the main "Telemetries" view section.
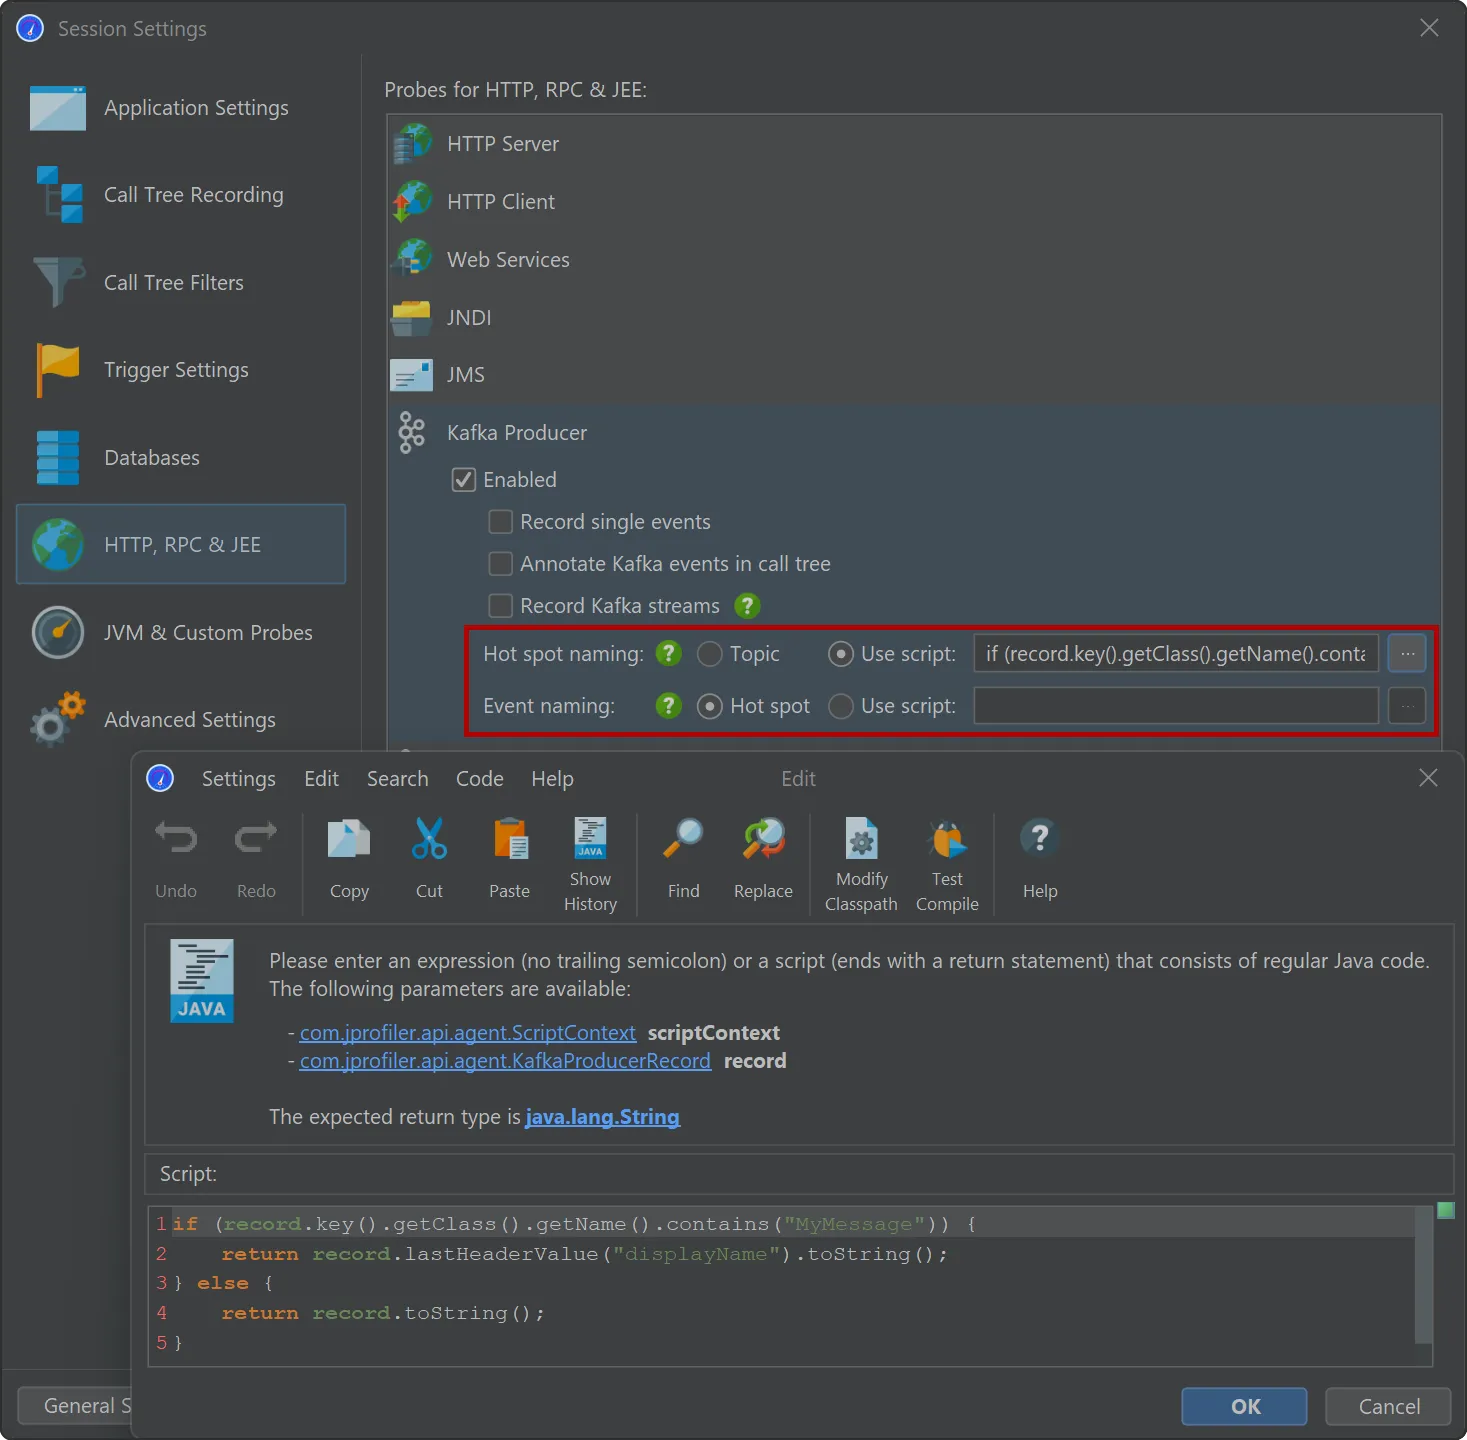
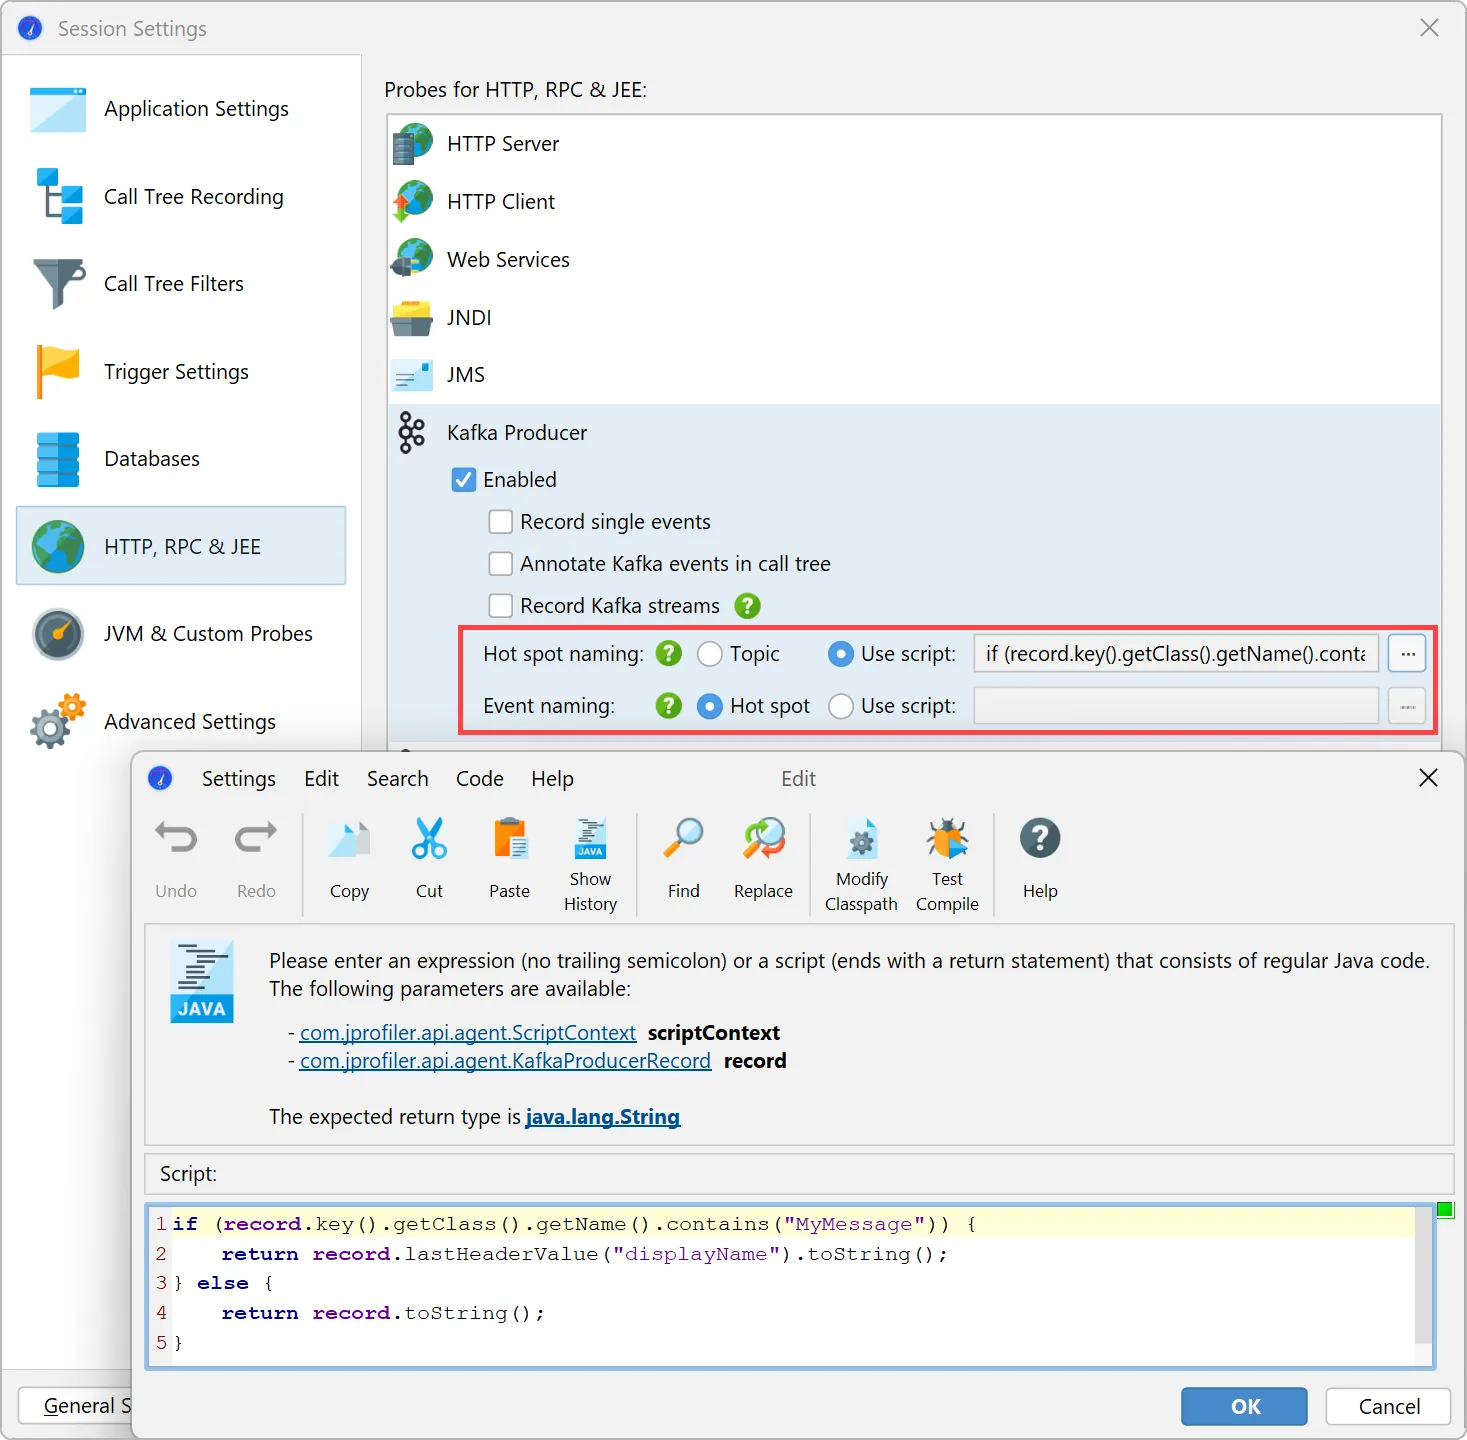
Both probes offer the same flexibility for naming hot spots and events. By default, hot spots are named with the message topic.
You can use a script to build the strings for the hot spots yourself using an API provided by JProfiler. Naming hot spots is important
because it determines the grouping in the hot spots view.
Optionally, you can use a different script for the naming of single events in the "Events" view. This will not affect hot spot grouping
and is a way to provide more detail for debugging.
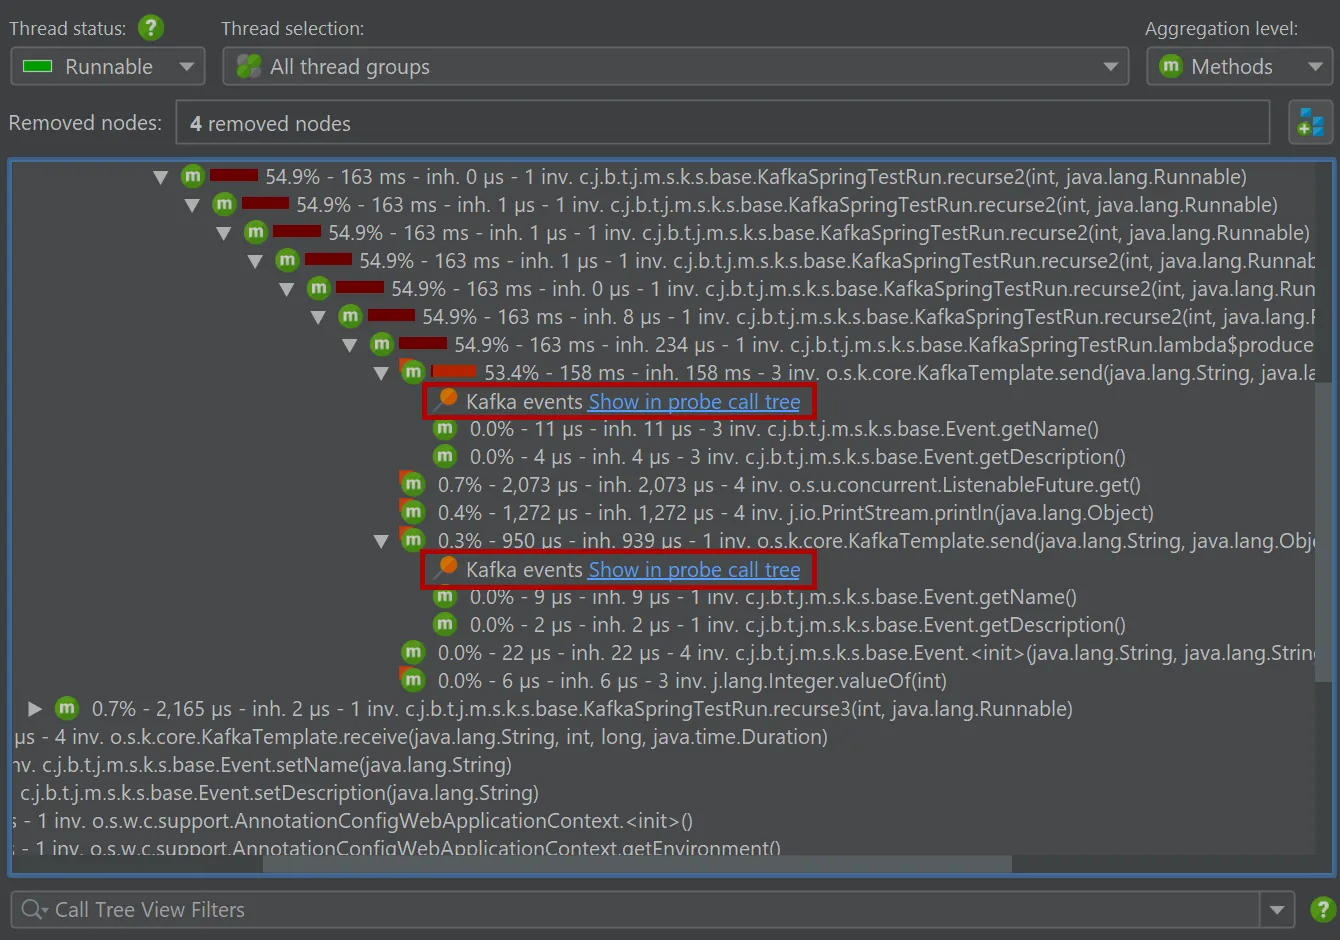
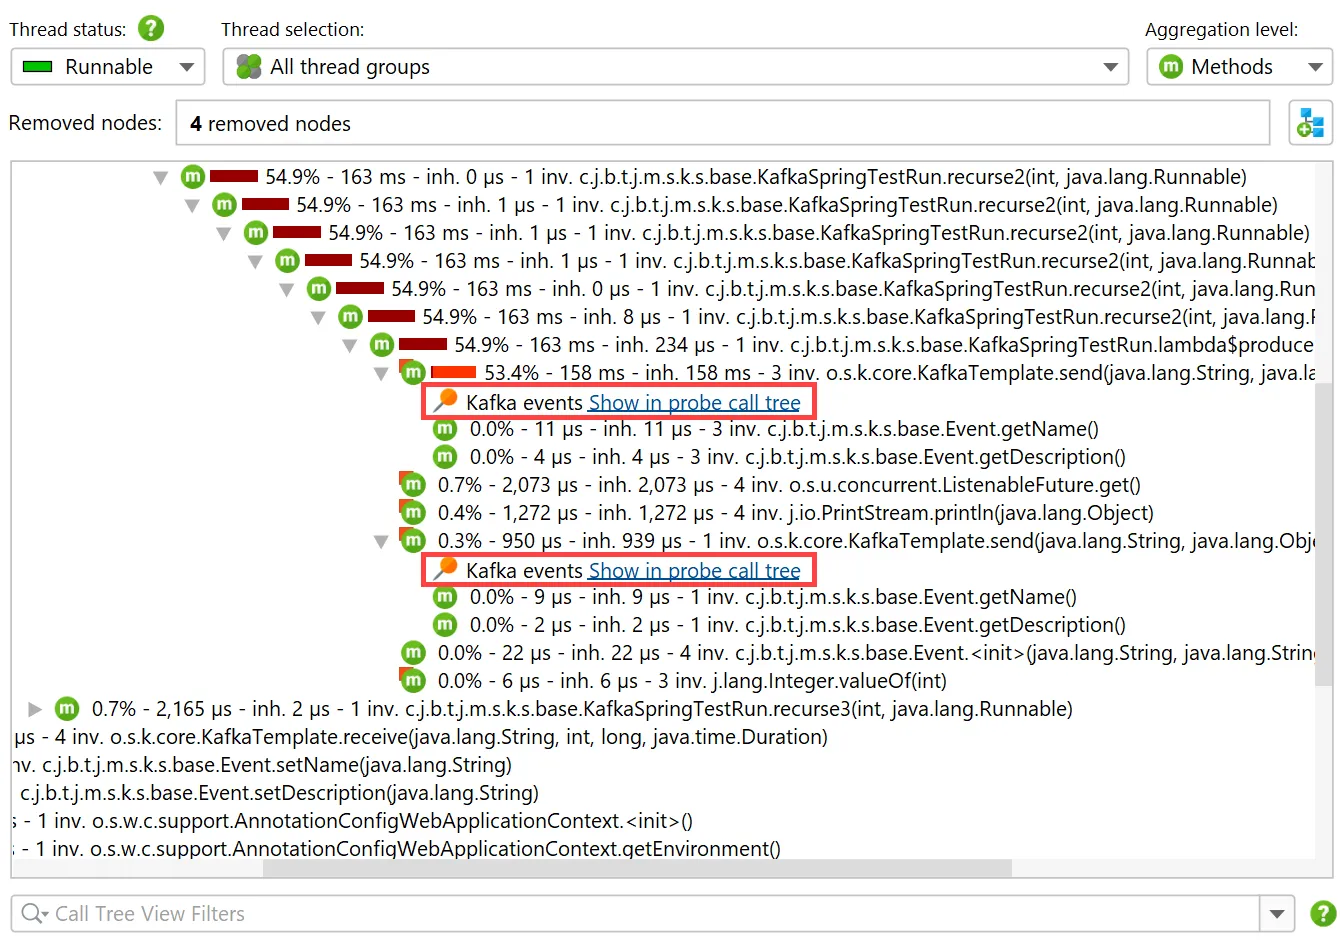
Recording events from either probe adds data in the regular call tree views in the "CPU views section". For the "Kafka producer" probe,
hyperlinks are inserted into the call tree for revealing the associated call stack in the call tree view of the probe.
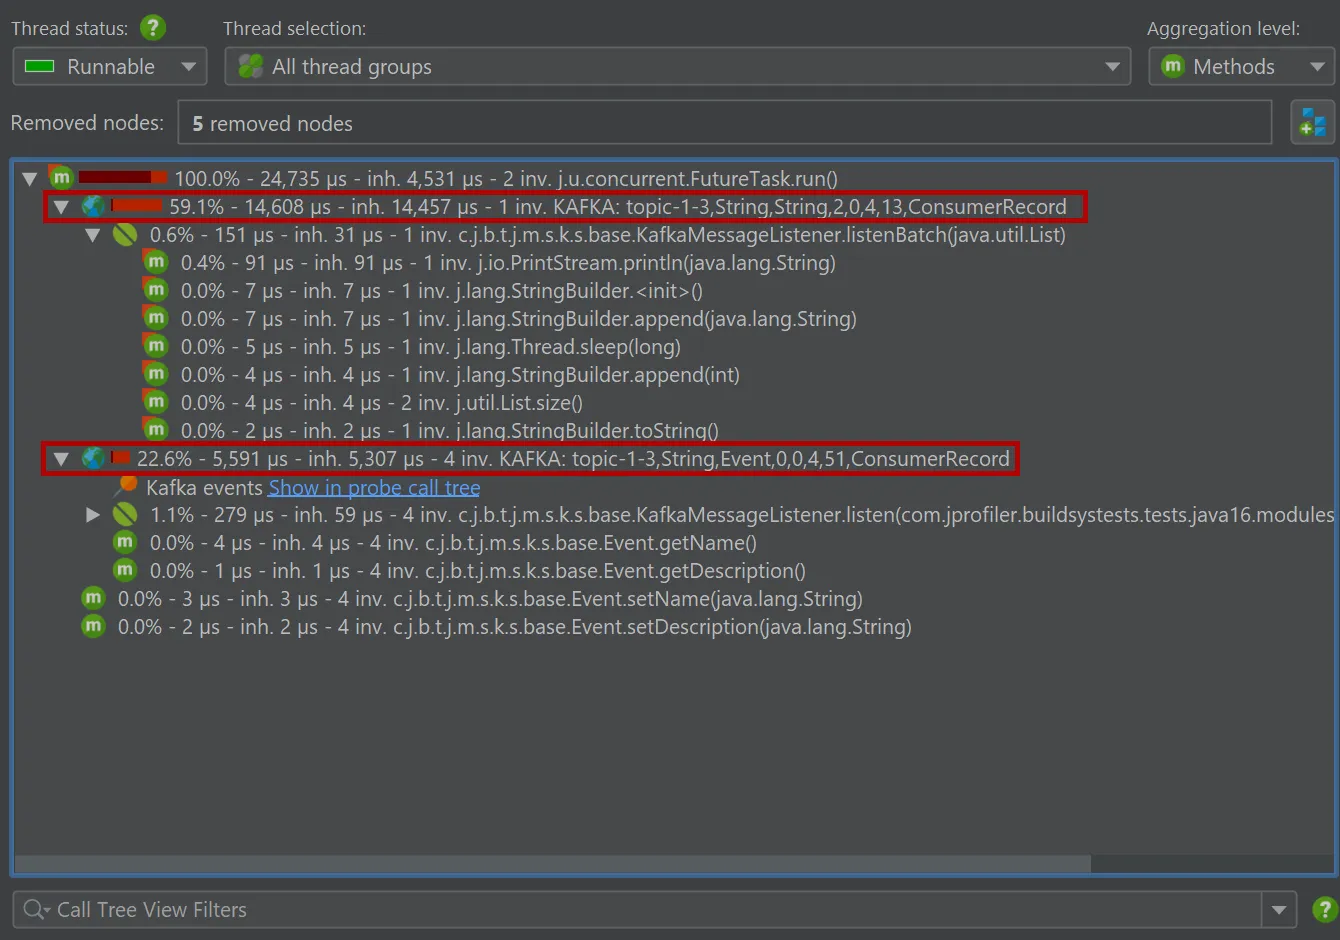
The Kafka consumer probe splits the call tree for Spring event listeners, so you can see the subtree for different types of messages
separately. The grouping is done with the configured "hot spots" naming.
An IDE integration for Visual Studio Code has been added. It is available in the
Visual Studio Marketplace and works together with a
local installation of JProfiler.
If the VS Code plugin cannot find the JProfiler installation automatically, it will ask you to locate it the first time you start a profiling
session.
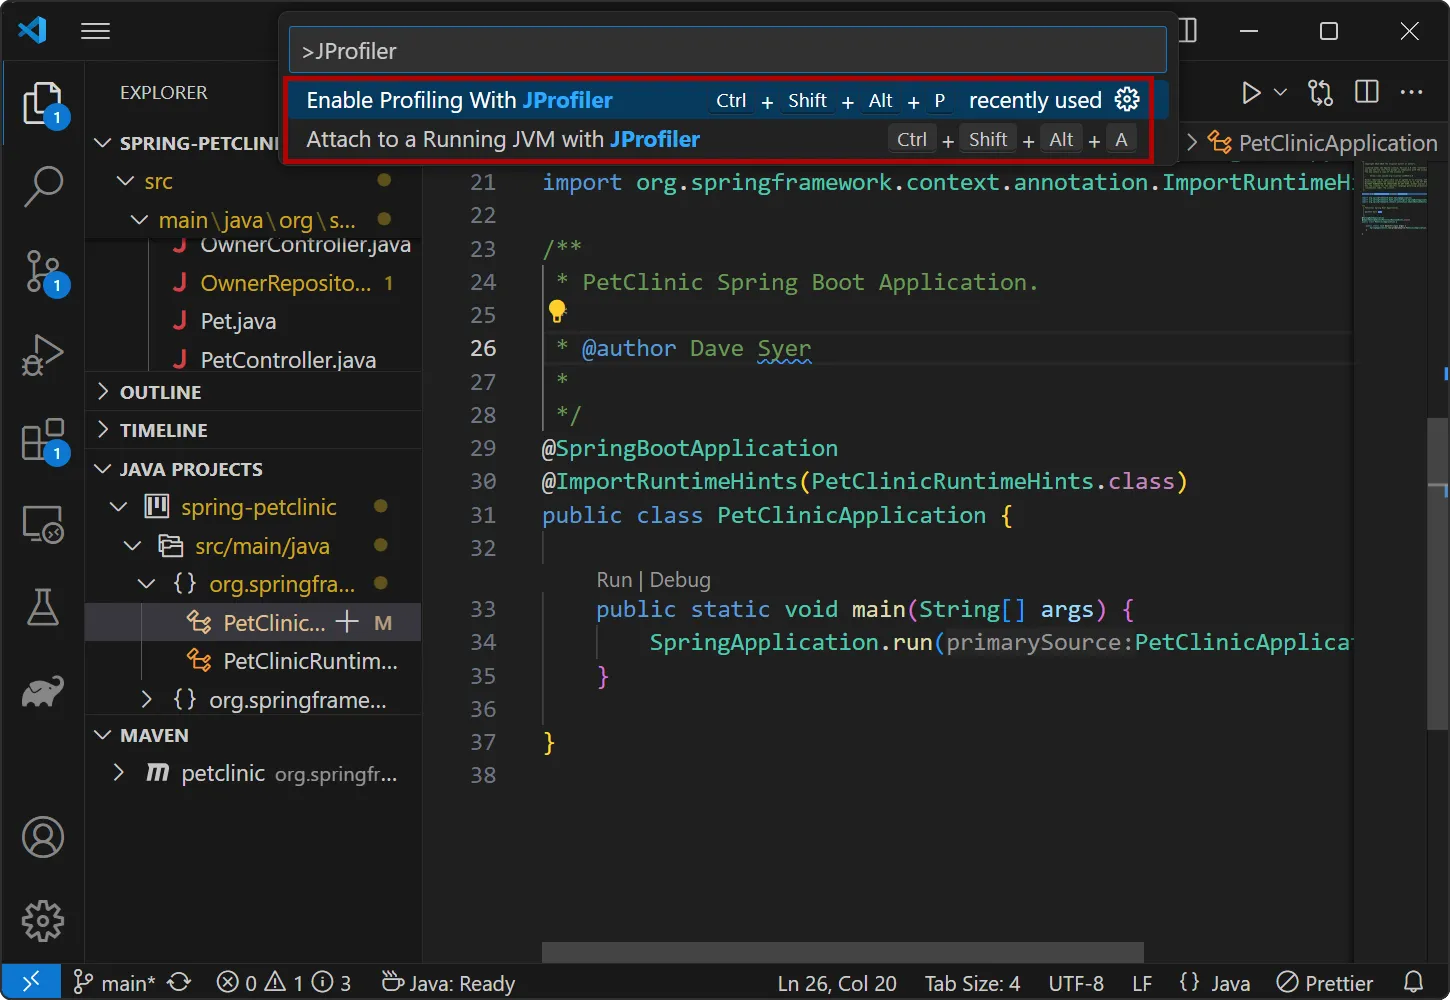
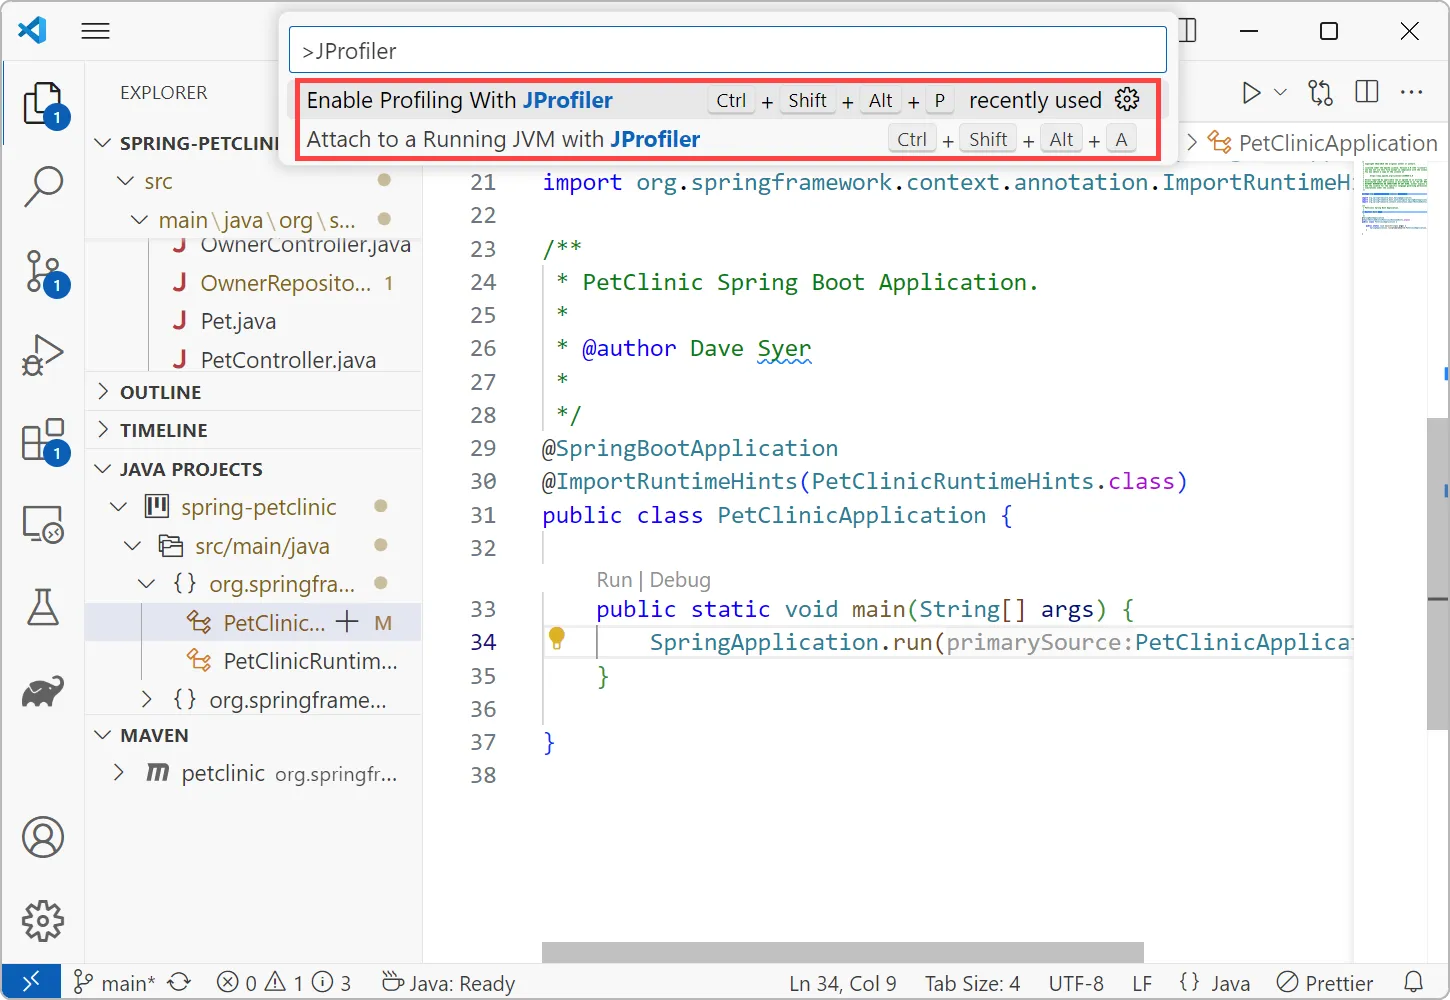
The extension adds two actions: With "Enable Profiling with JProfiler" you toggle the profiling mode, so that all debug and run actions
will start profiling for Java launch configurations. With "Attach to a running JVM with JProfiler" you can use the attach mode feature for
local or remote JVMs and get source code navigation into VS code.
Depending on the status of this pull request for the vscode-gradle
plugin, profiling Gradle tasks is also supported by the "Enable Profiling with JProfiler" action.
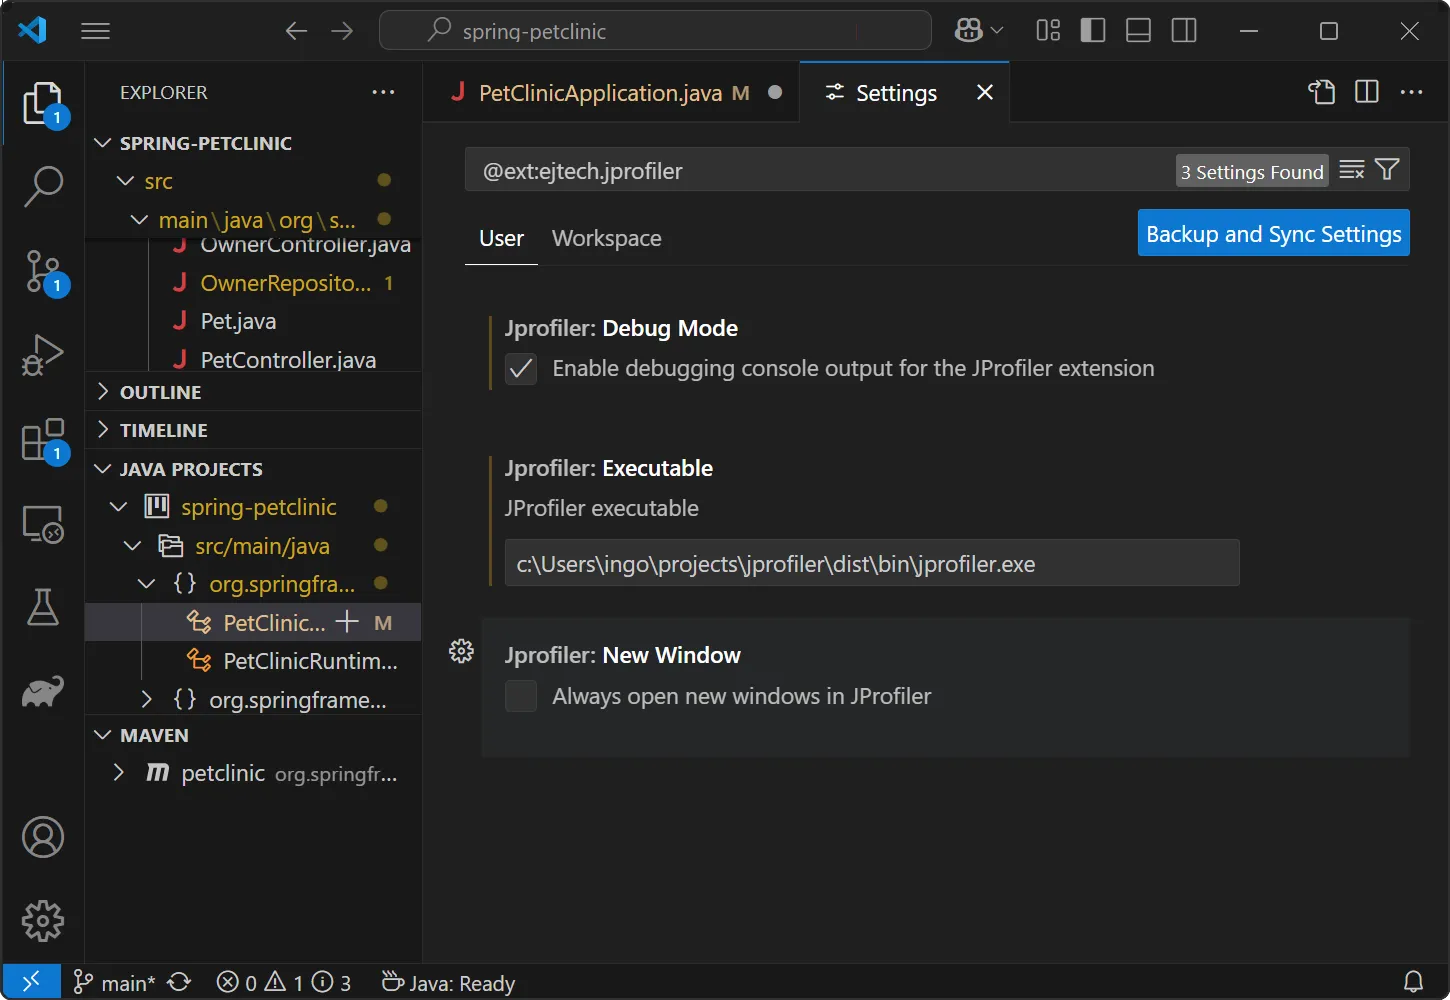
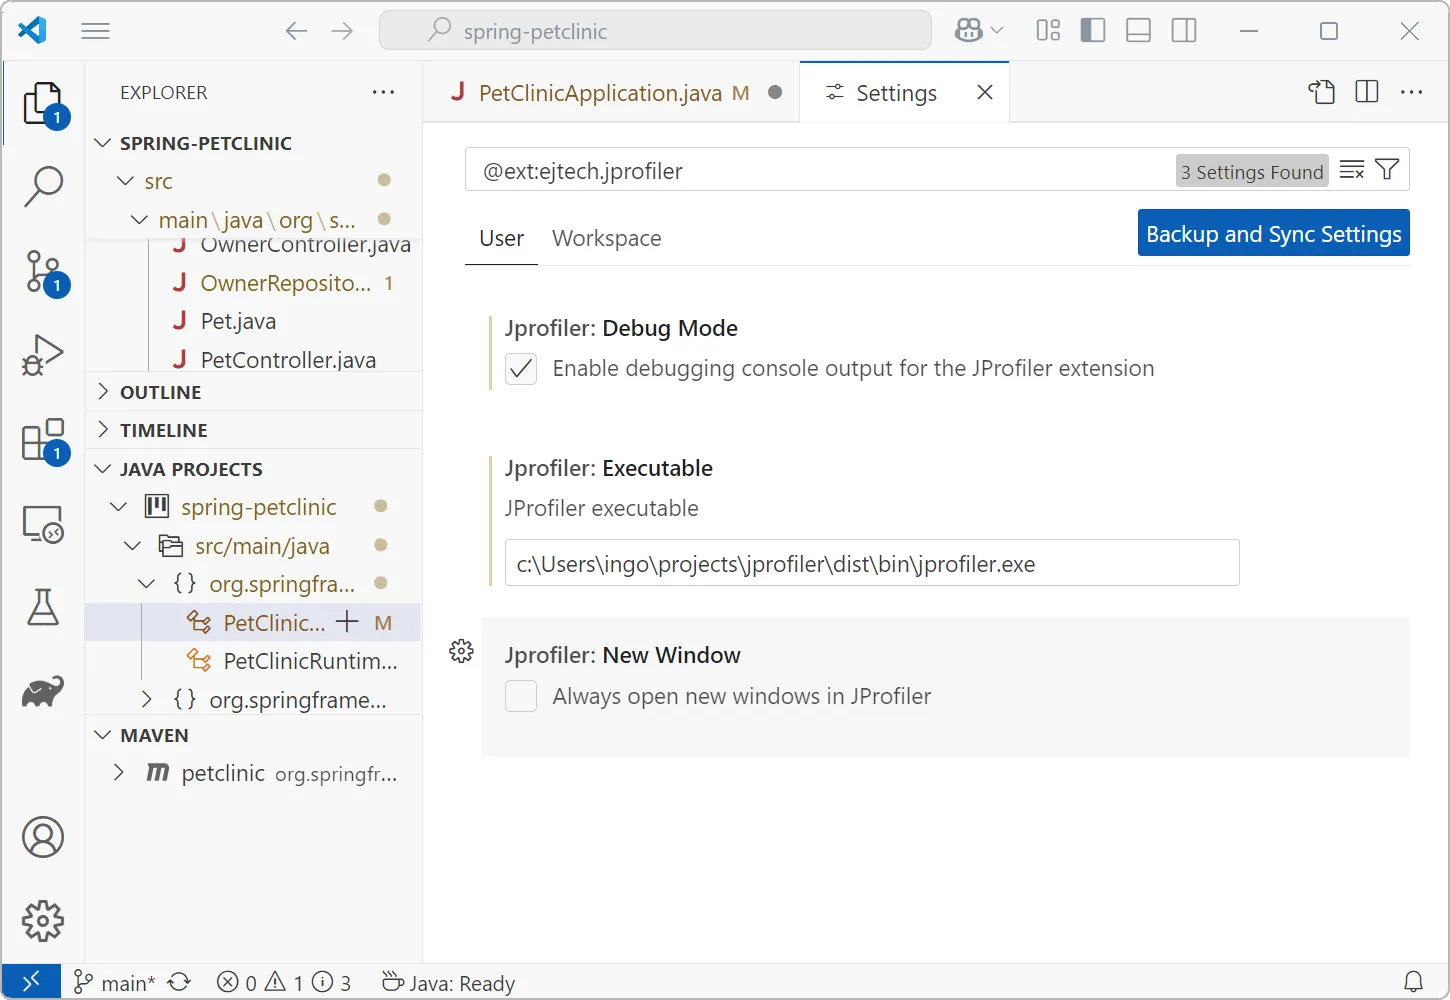
The JProfiler plugin only has a few settings, notably for the location of the JProfiler executable and a setting whether to open new windows
for new profiling sessions.
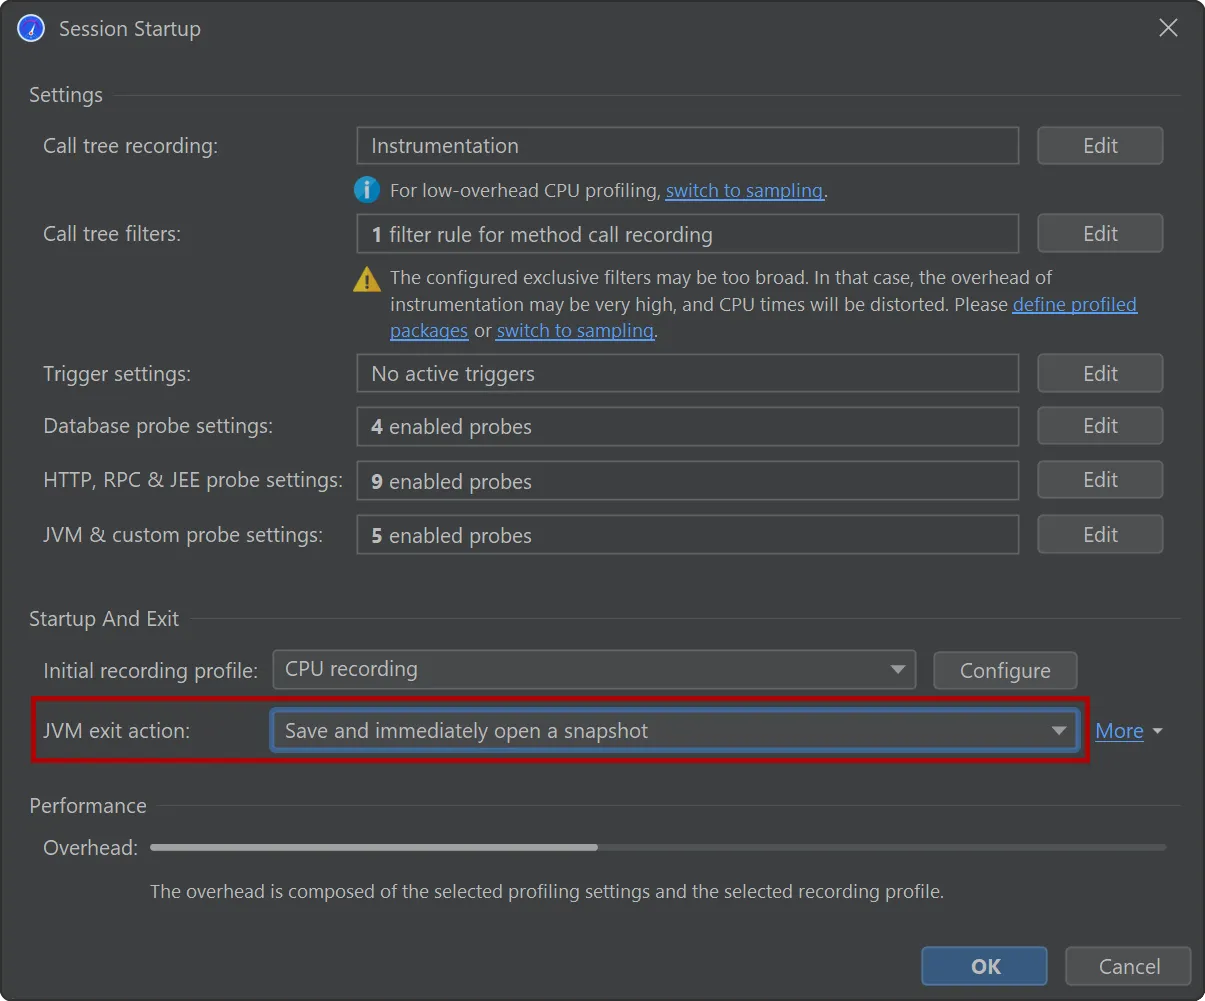
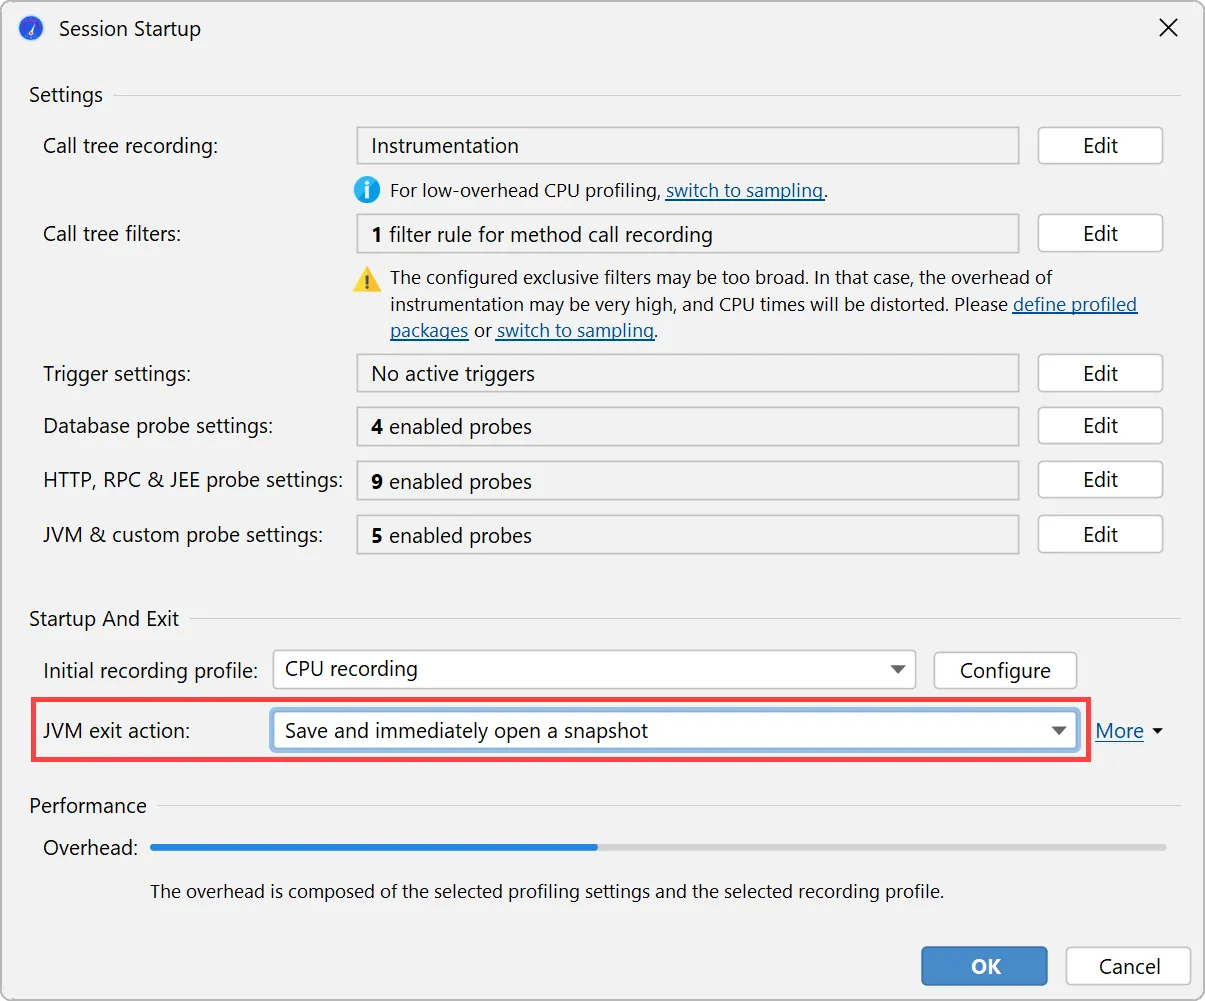
All other profiling settings are handled by JProfiler and stored on a per-project basis. When you start a profiling session, the
session startup dialog gives you a chance to view and modify all settings in one place.
When profiling unit tests, JProfiler will automatically suggest saving and immediately opening a snapshot when the JVM exits.
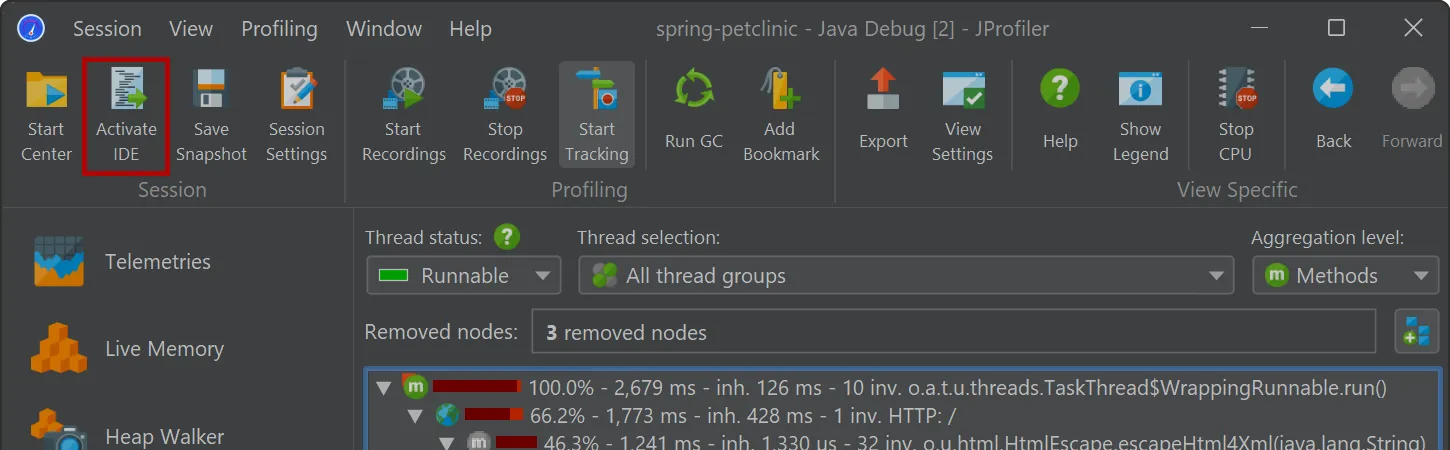
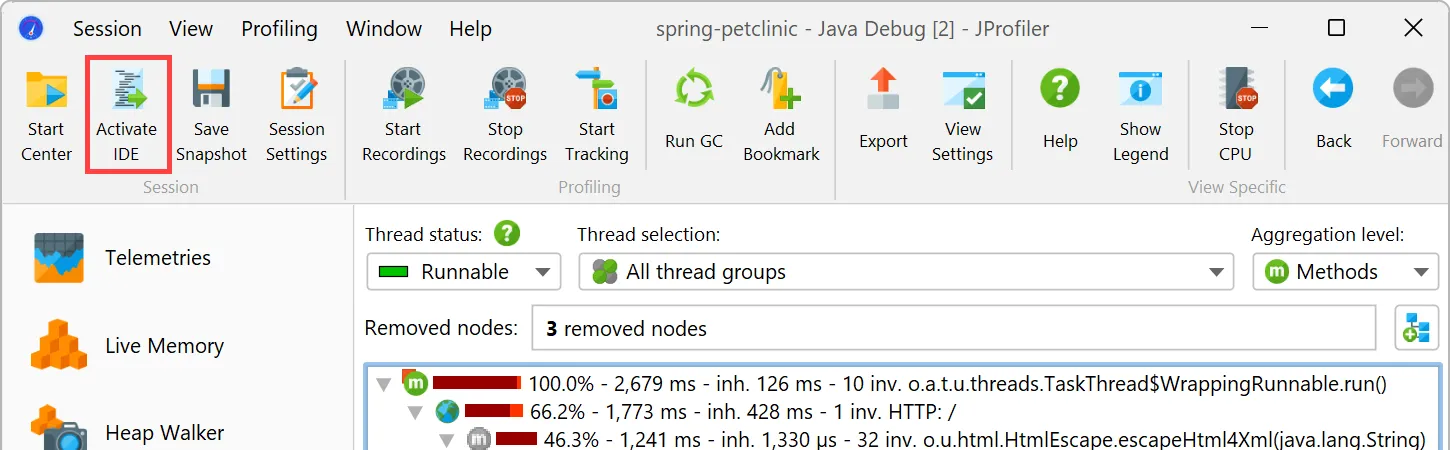
Switching to VS code when working with the JProfiler UI is seamlessly possible with the "Activate IDE" action (F11).
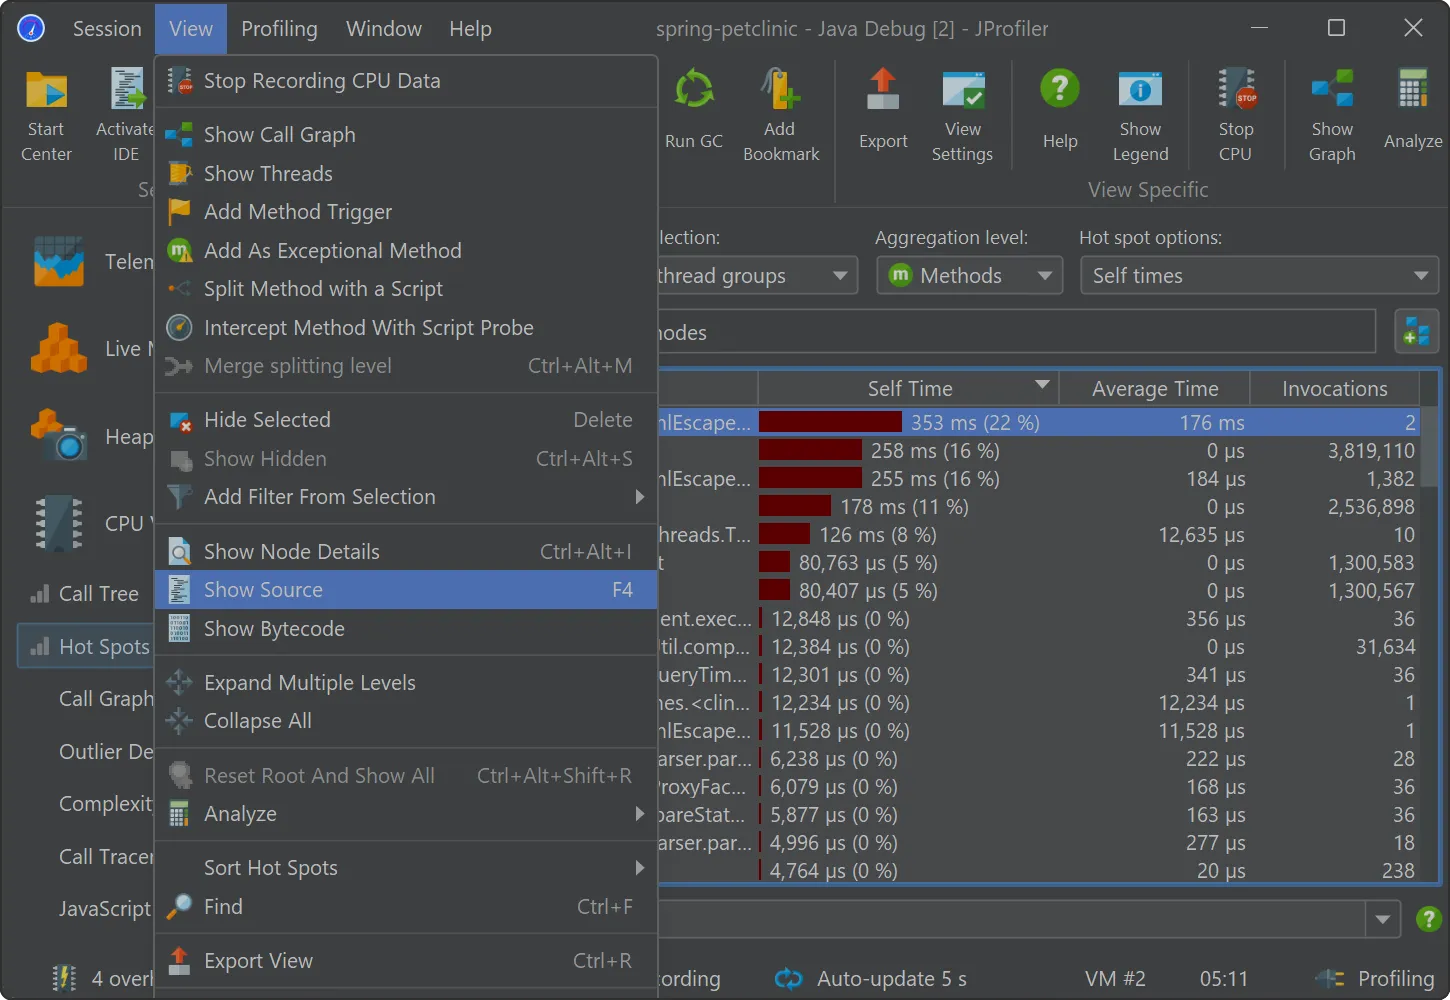
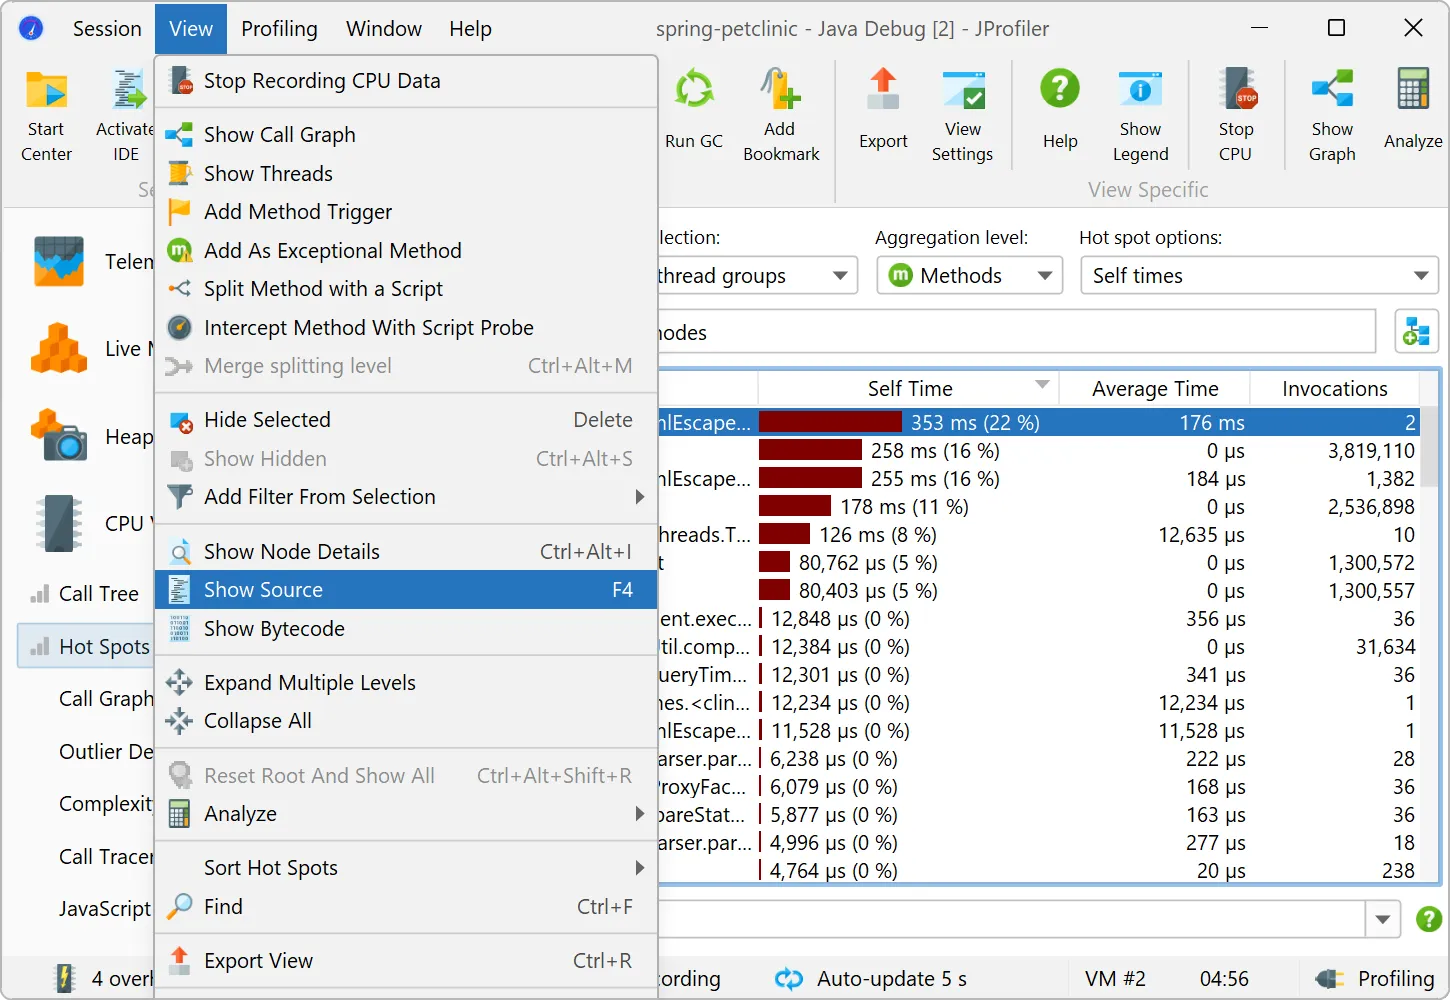
To show the source code of a selected class or method, use the "Show source" action that is visible everywhere in JProfiler. The VS
Code UI will be brought to the front, and the associated source code will be shown.
Another useful feature provided by the JProfiler VS Code plugin is that you can open JProfiler, HPROF and PHD snapshots from inside
VS Code to get source code navigation from the JProfiler UI into VS Code.
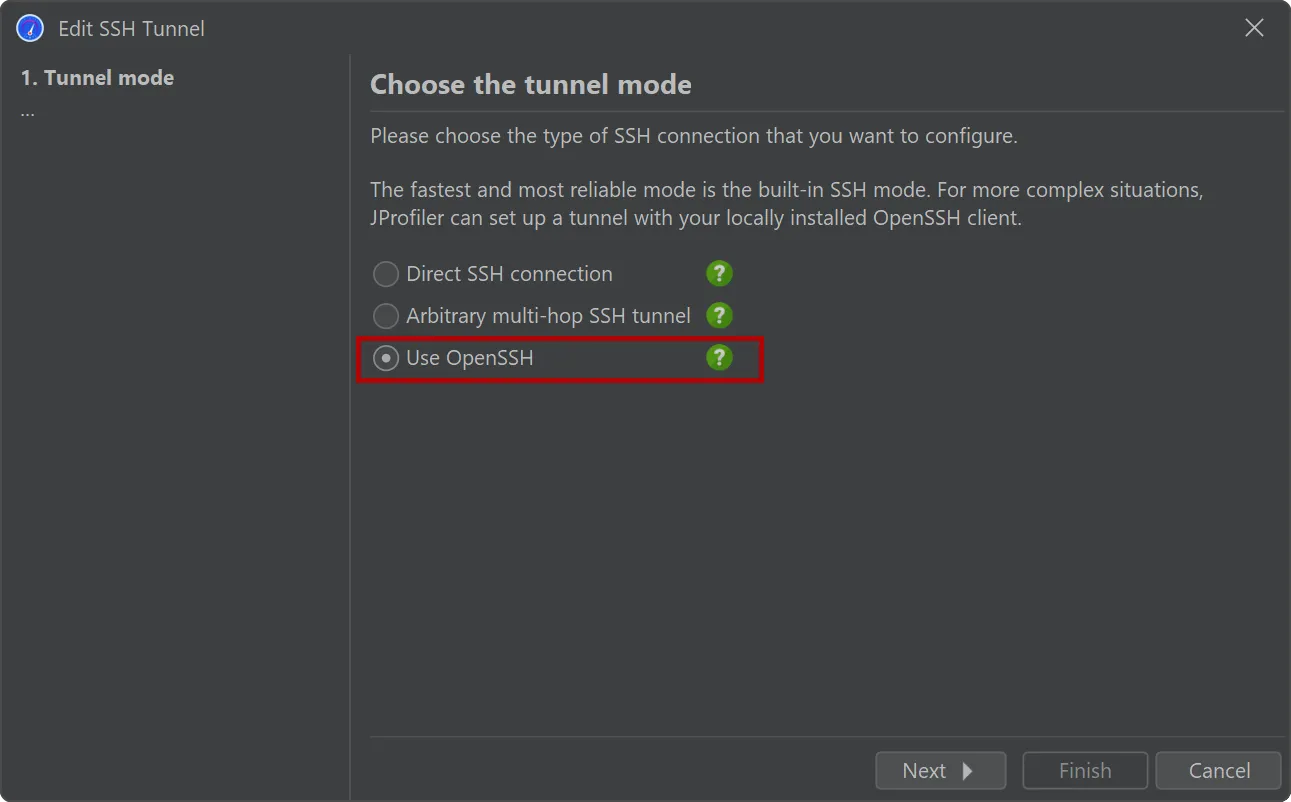
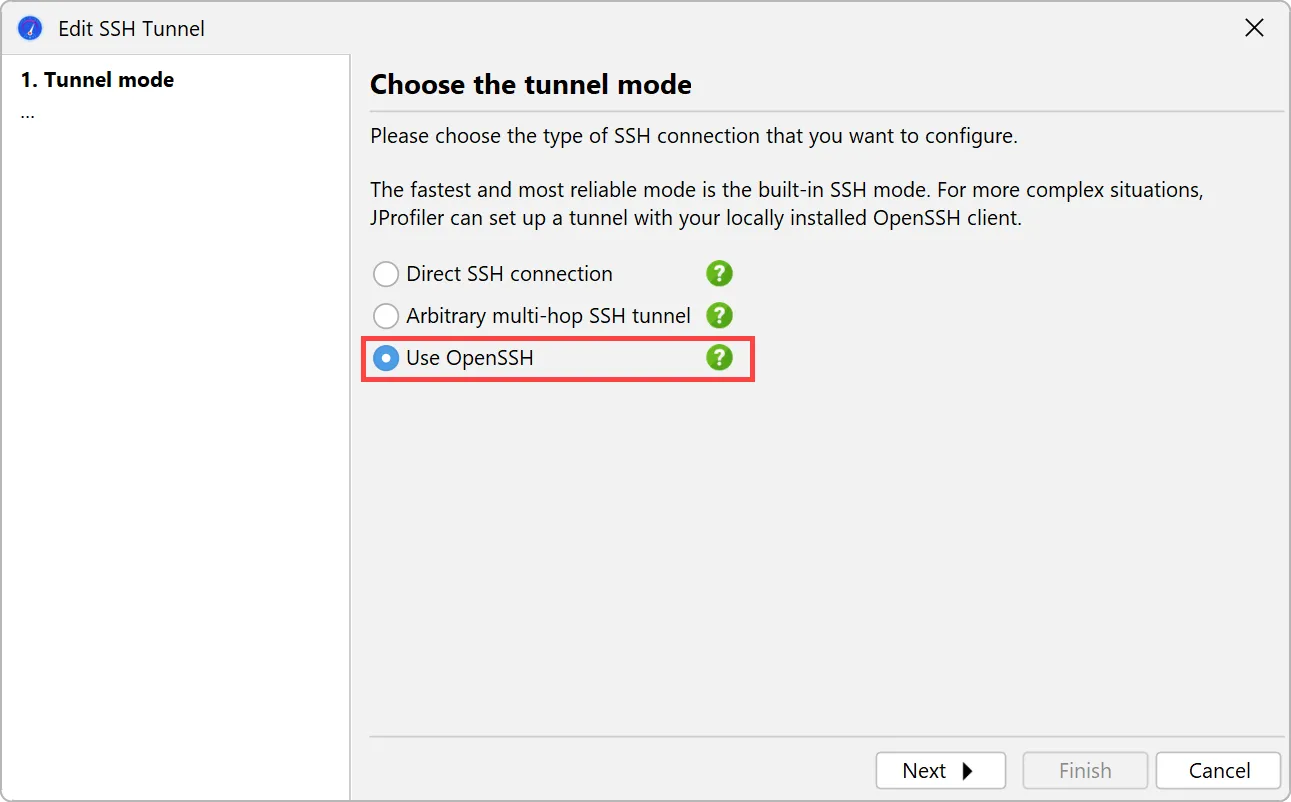
An alternative SSH mode via OpenSSH has been added. This is important for being able to profile JVMs on all types of remote
machines without any configuration.
JProfiler ships with a built-in SSH client for SSH connections that supports password and public key authentication. To support
other authentication types and complex network topologies, a new SSH tunnel type was added, that uses your local OpenSSH installation.
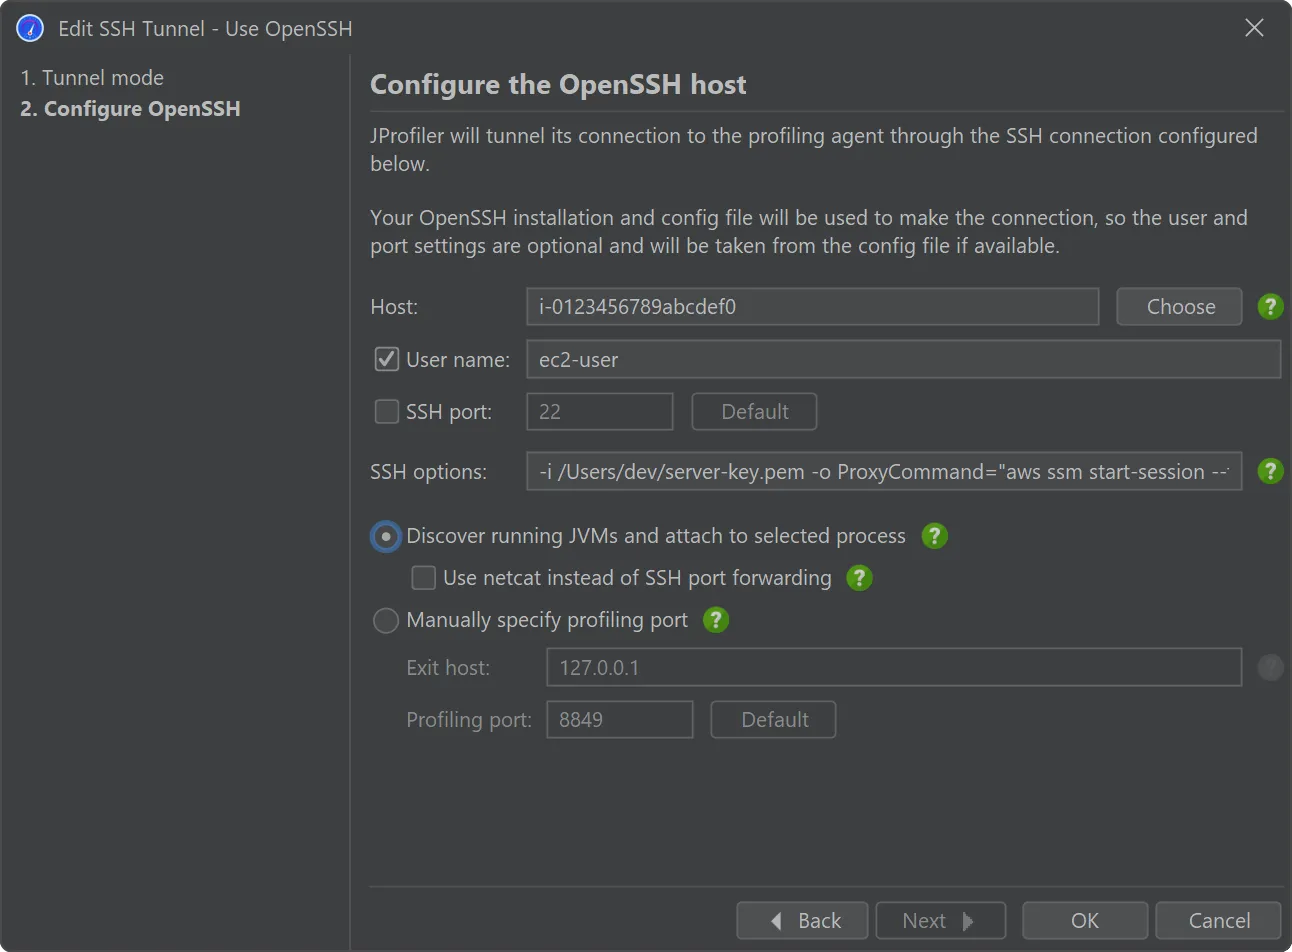
For example, if you want to connect to an EC2 instance via AWS session manager, the built-in SSH client does not work because it cannot
tunnel through an arbitrary proxy. In the
AWS documentation,
you get a list of options that you can either add to the OpenSSH config file or directly on the command line, both of which work with the
new OpenSSH mode in JProfiler. This involves a ProxyCommand option that tunnels the connection through the aws
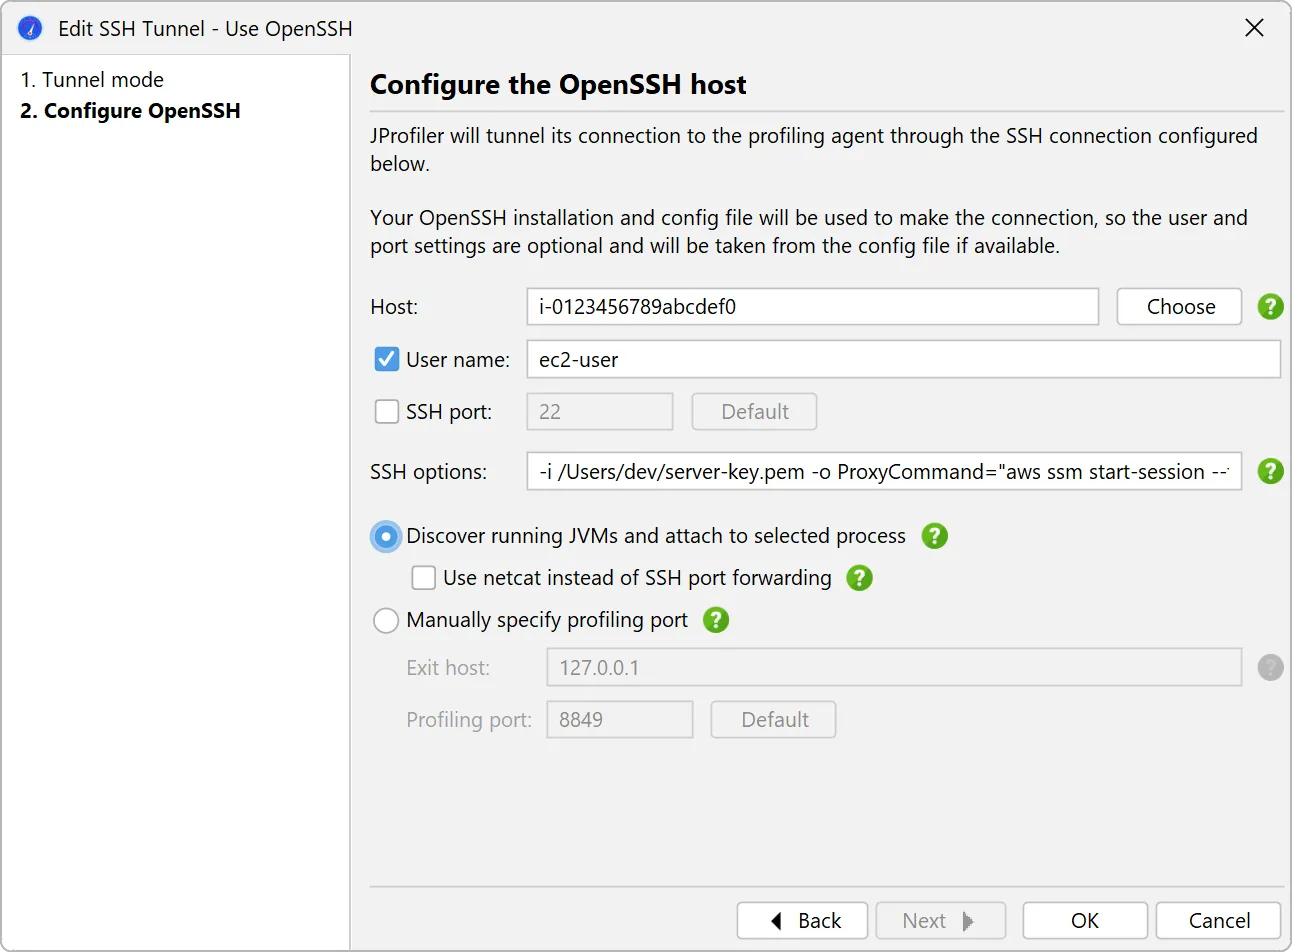
executable. In the screenshot below, the "SSH options" text field contains these arguments.
The only required input for the OpenSSH mode is the host name.
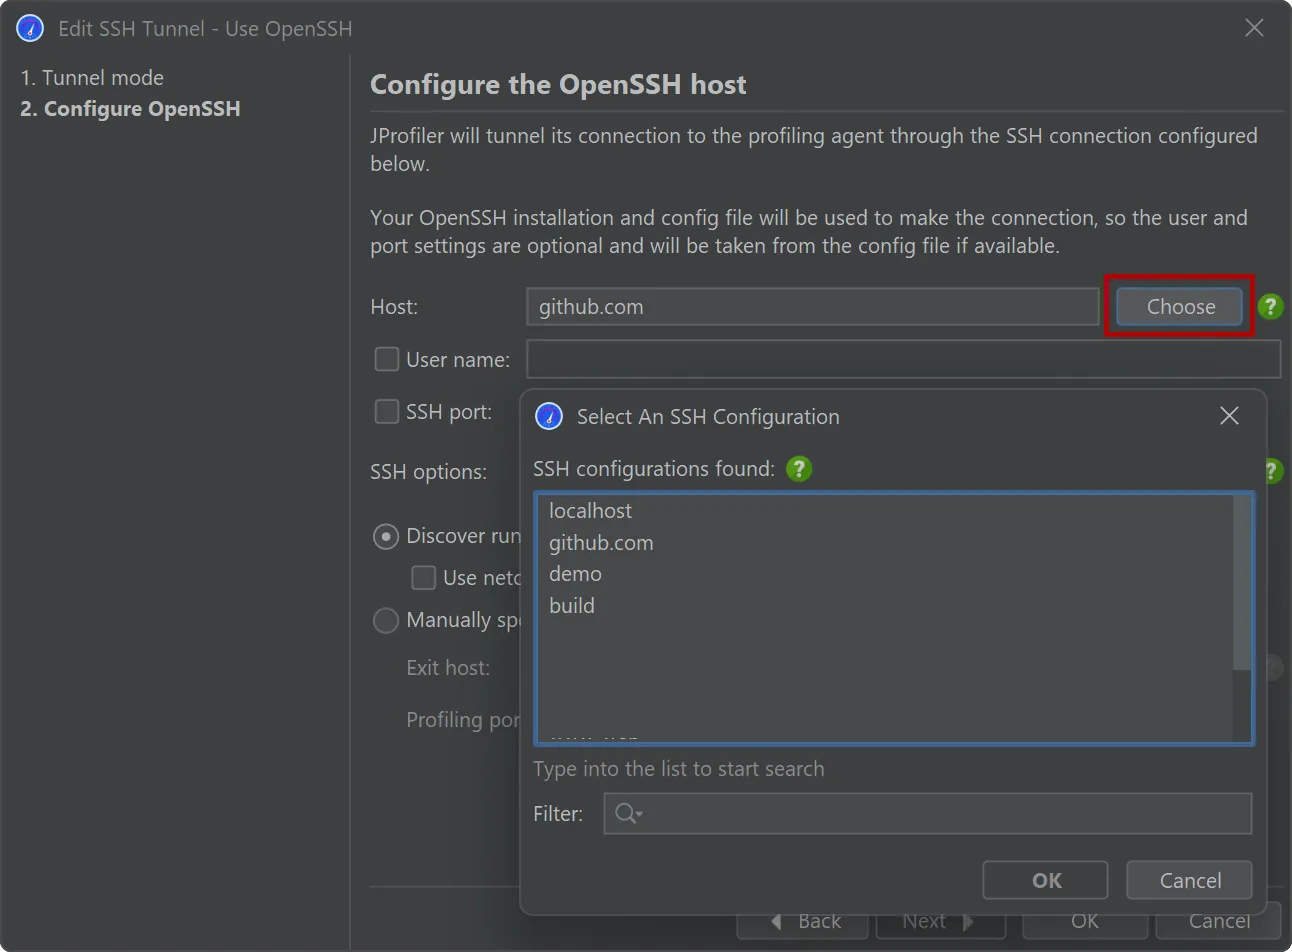
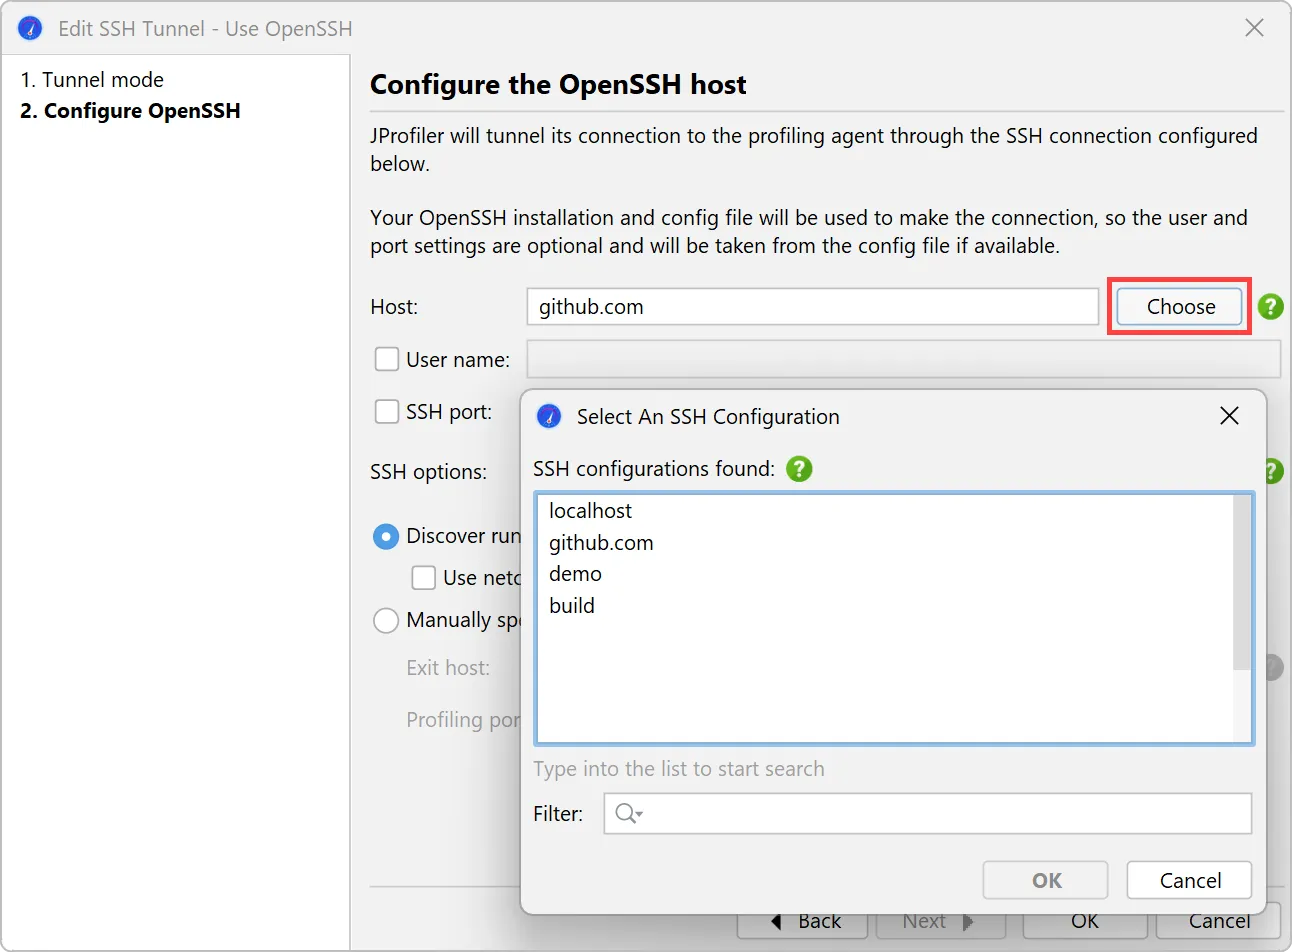
In the case where you use the OpenSSH config file to define your fully configured SSH servers, you can easily
select them with the "Choose" button next to the "Host" text field.
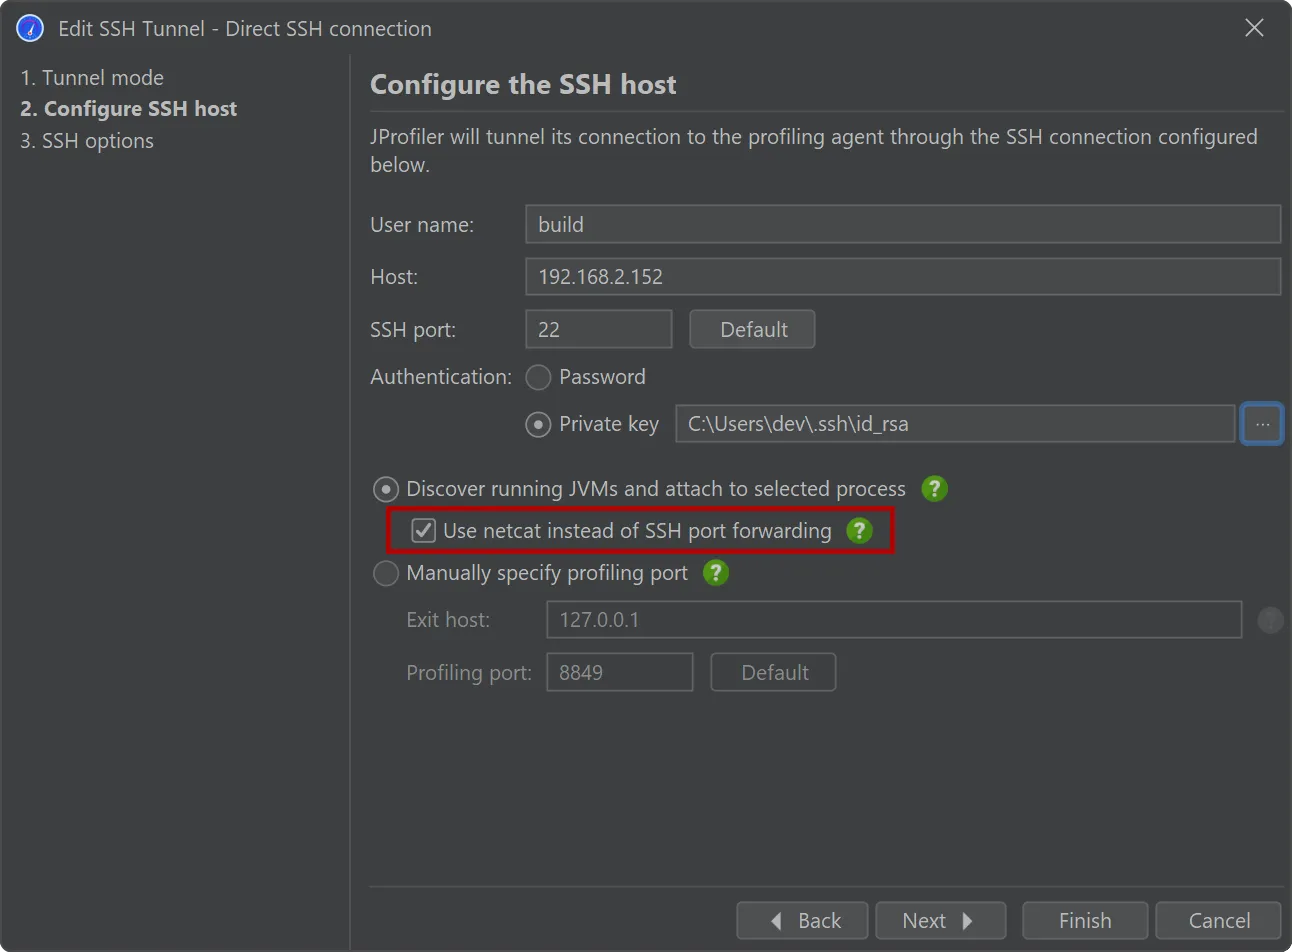
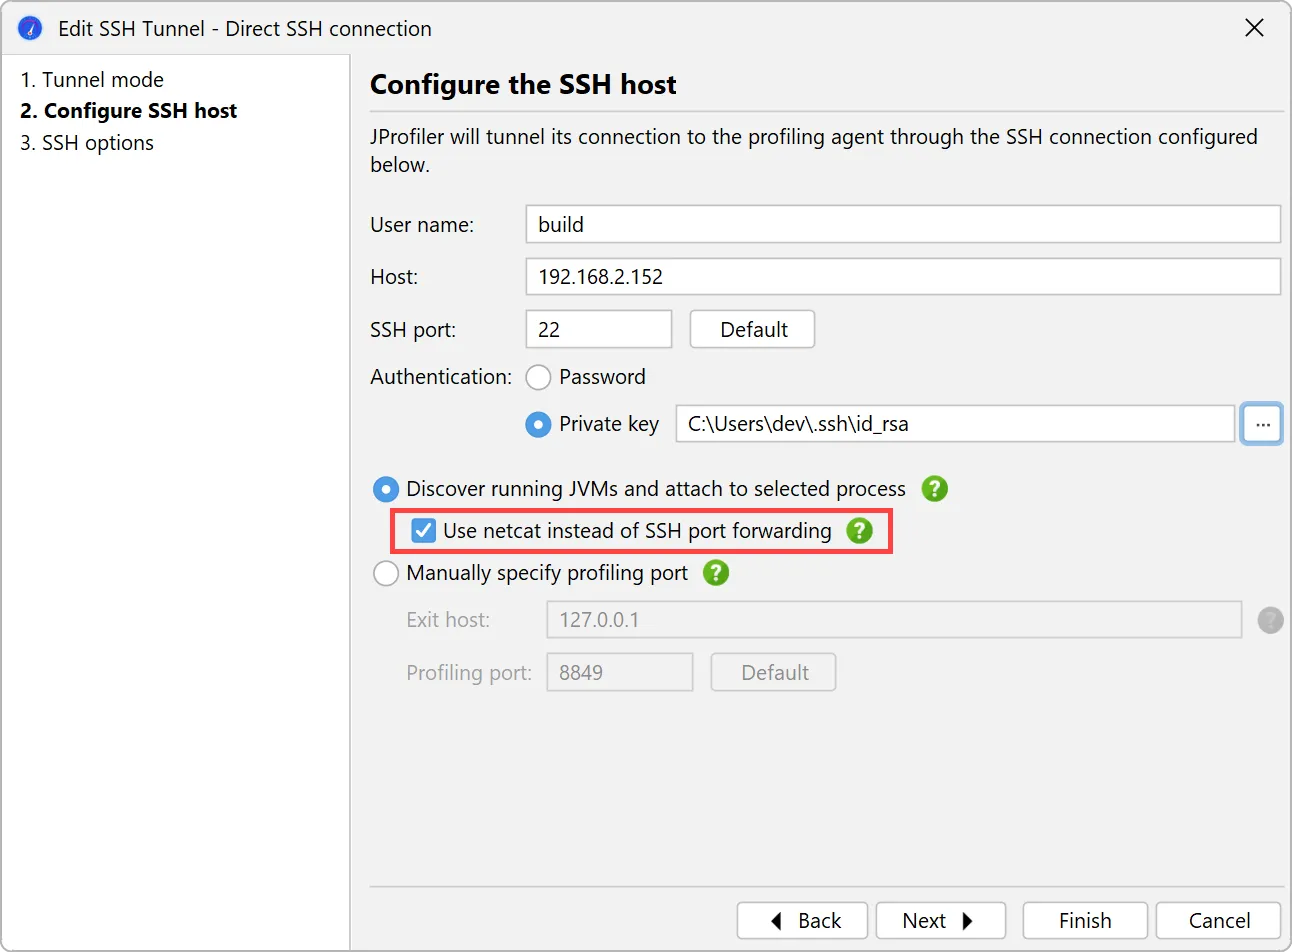
An alternative netcat SSH mode has been added for SSH hosts where port forwarding is disabled.
Many security-hardened production systems disable SSH port forwarding. In those cases, previous versions of JProfiler could not establish
an SSH tunnel through such machines. While SSH port forwarding is still the preferred option for SSH connections due to its stability and
better error reporting, JProfiler 15 adds a "netcat mode" that can optionally be enabled to fix this issue.
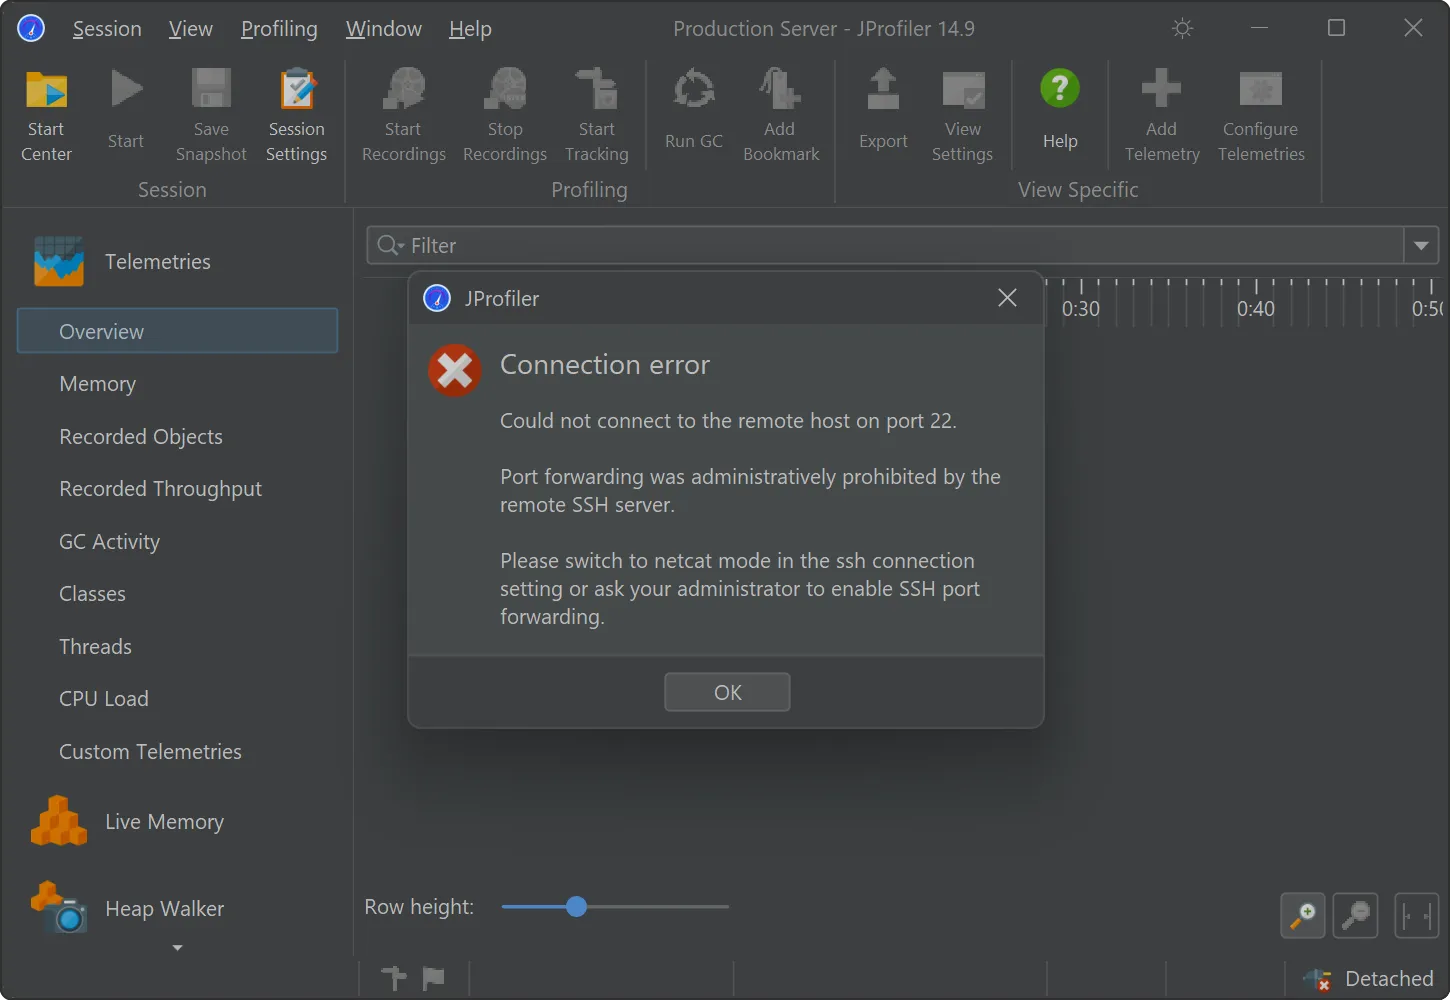
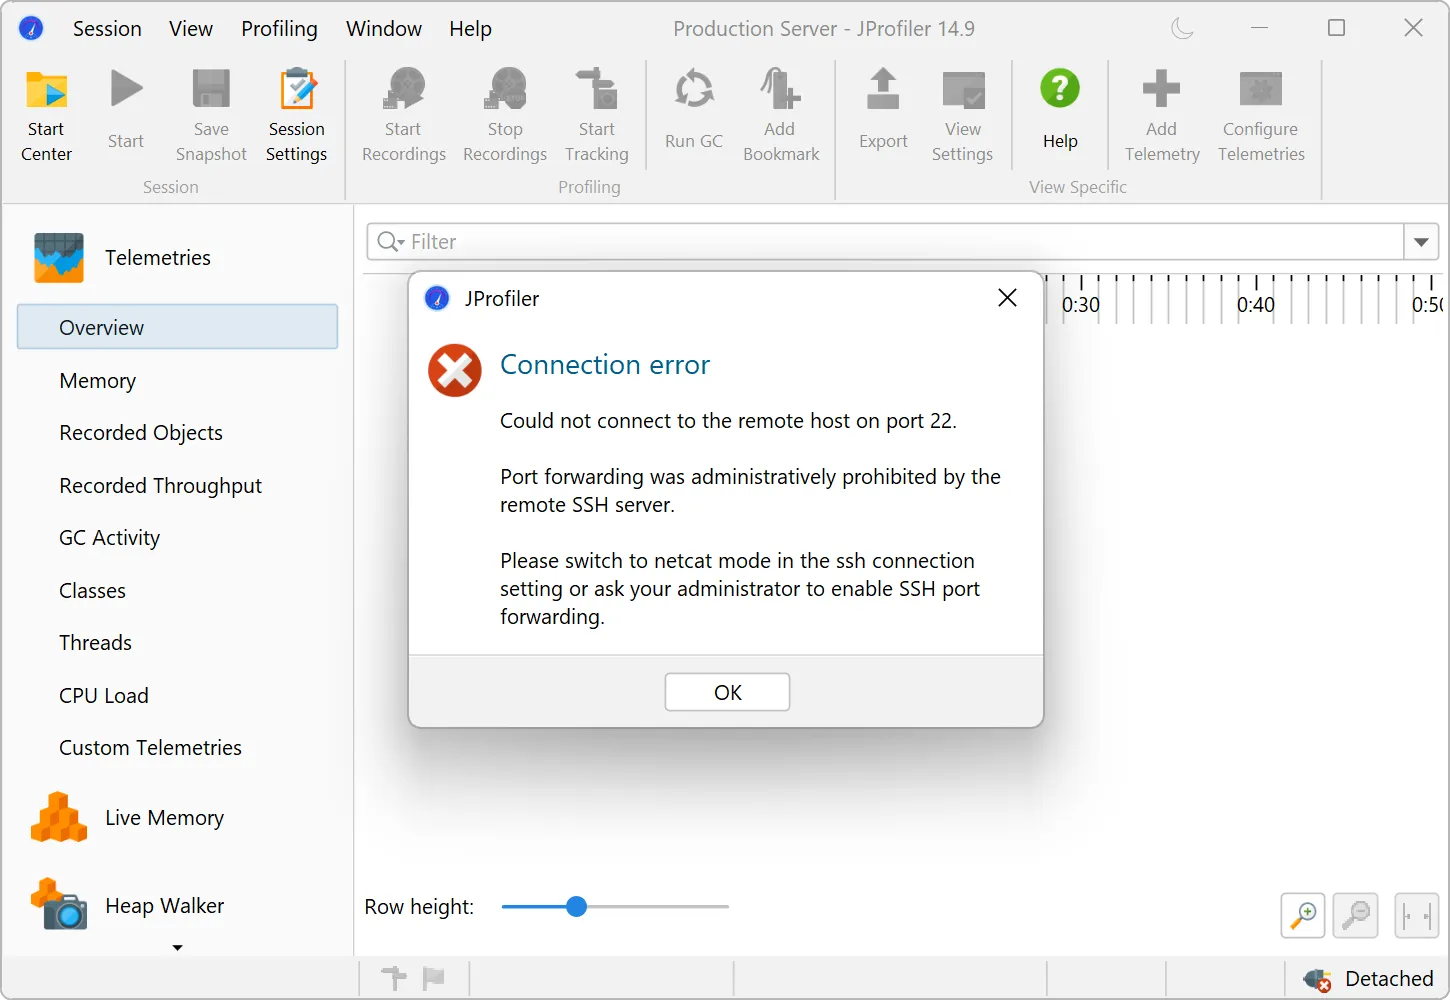
When a connection fails in such a way that disabled port forwarding may be to blame, JProfiler suggest switching to the netcat mode.
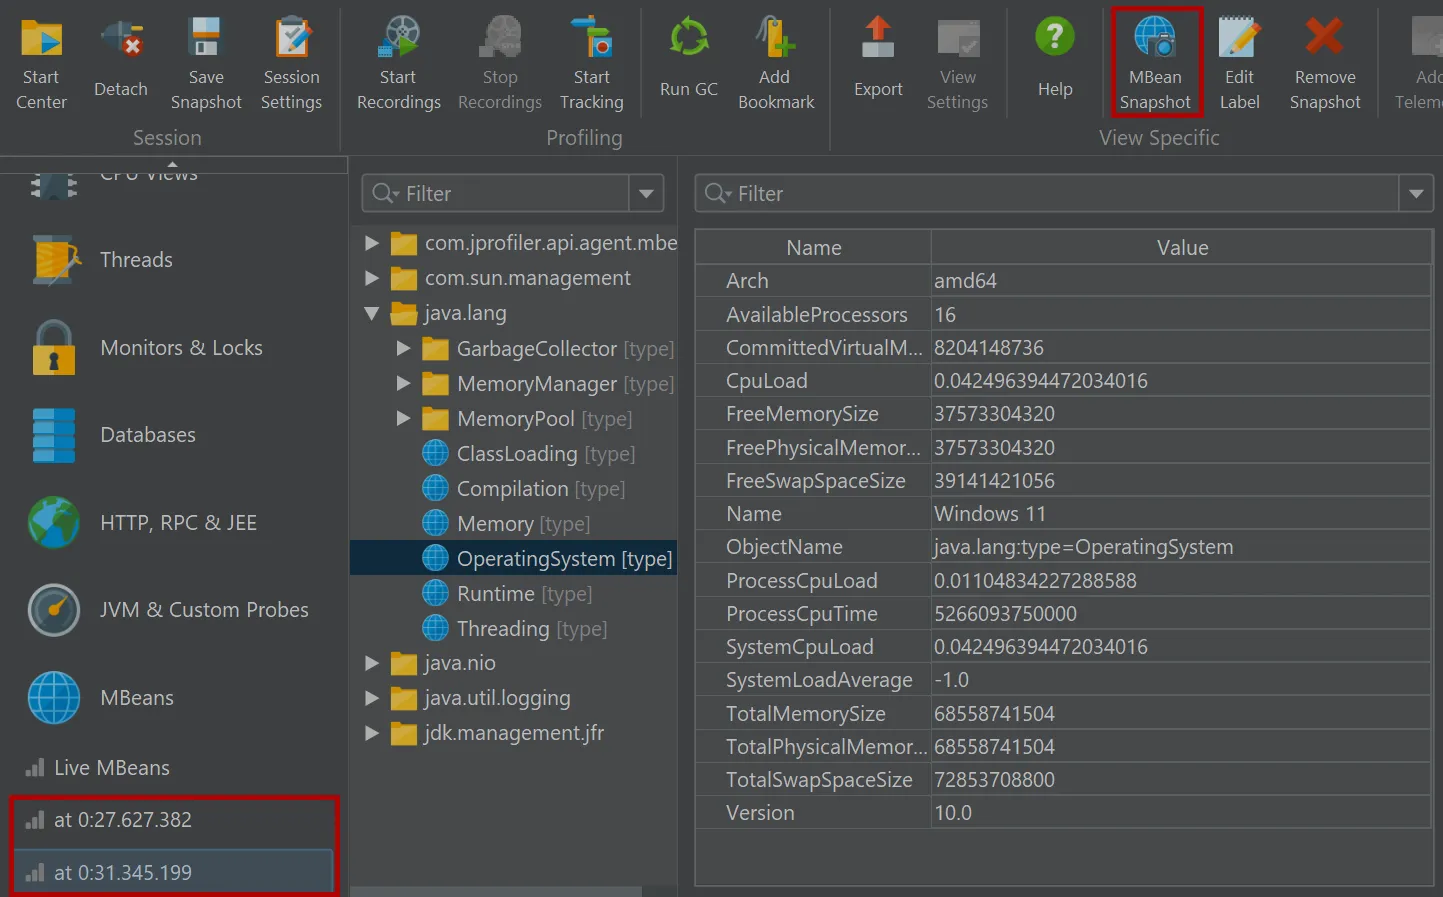
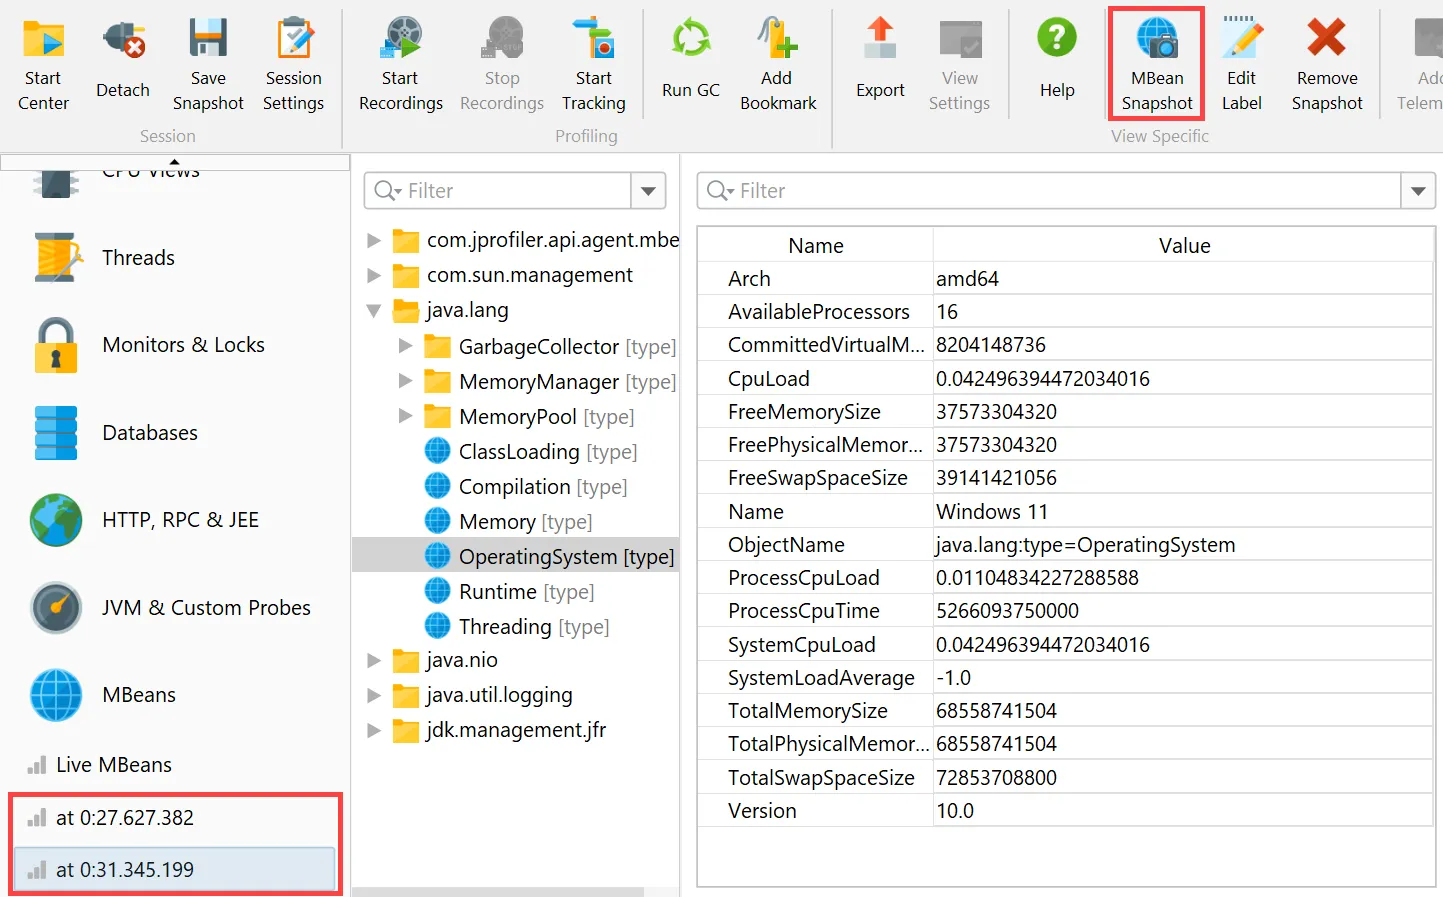
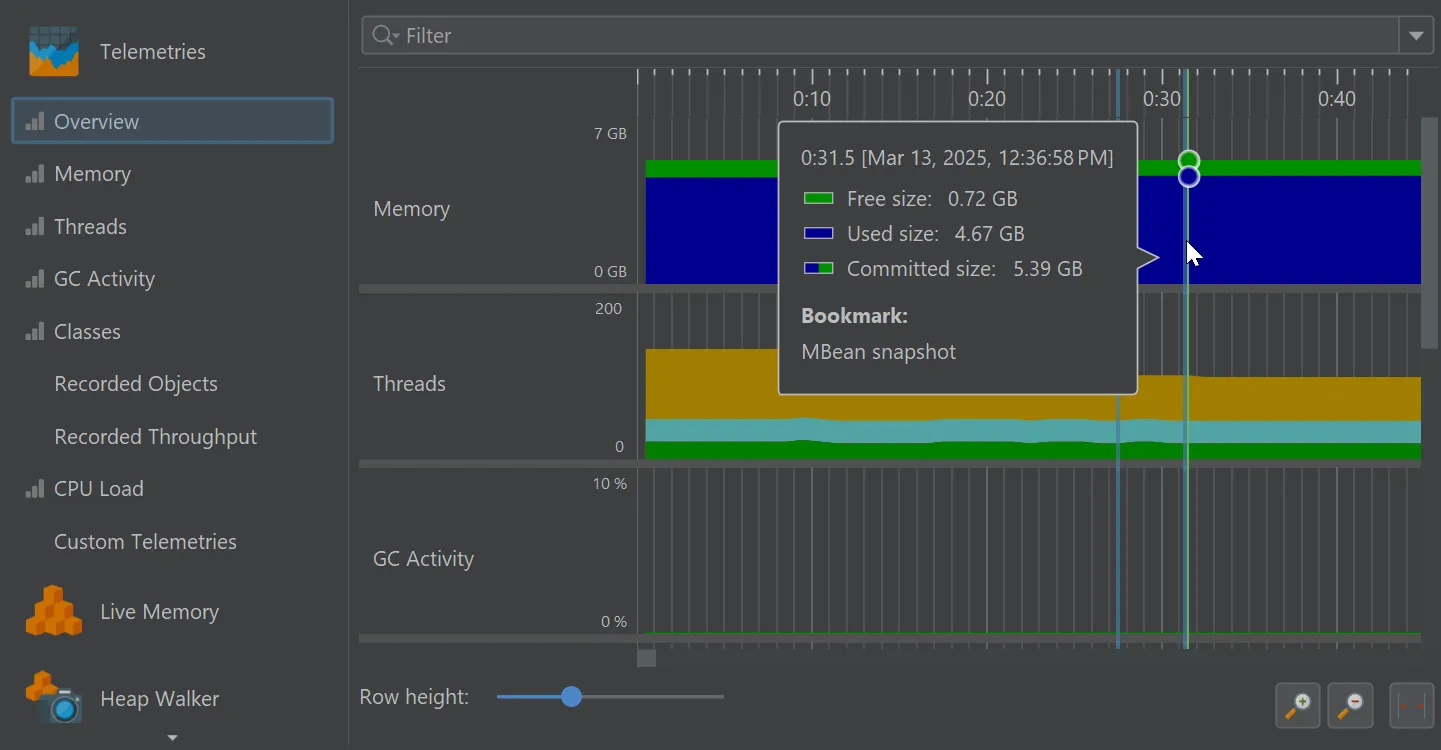
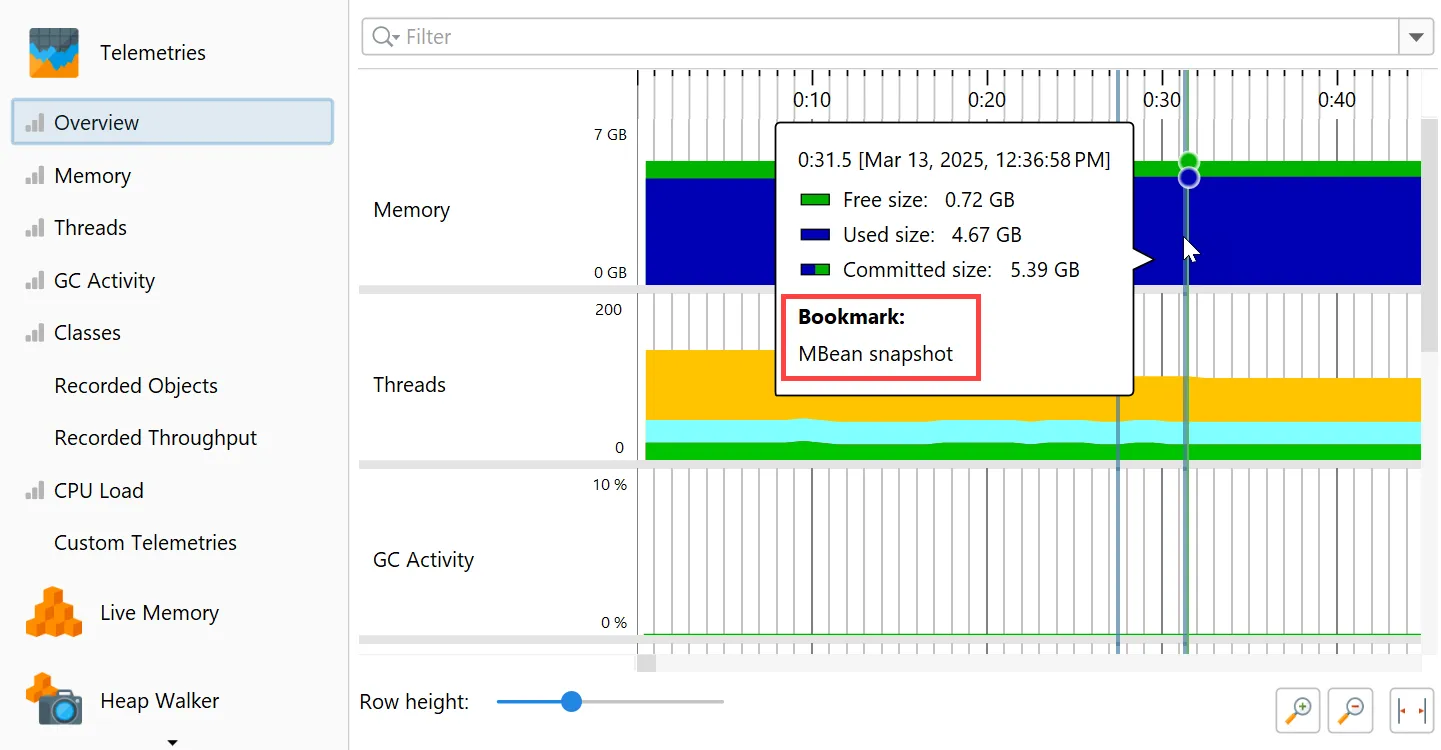
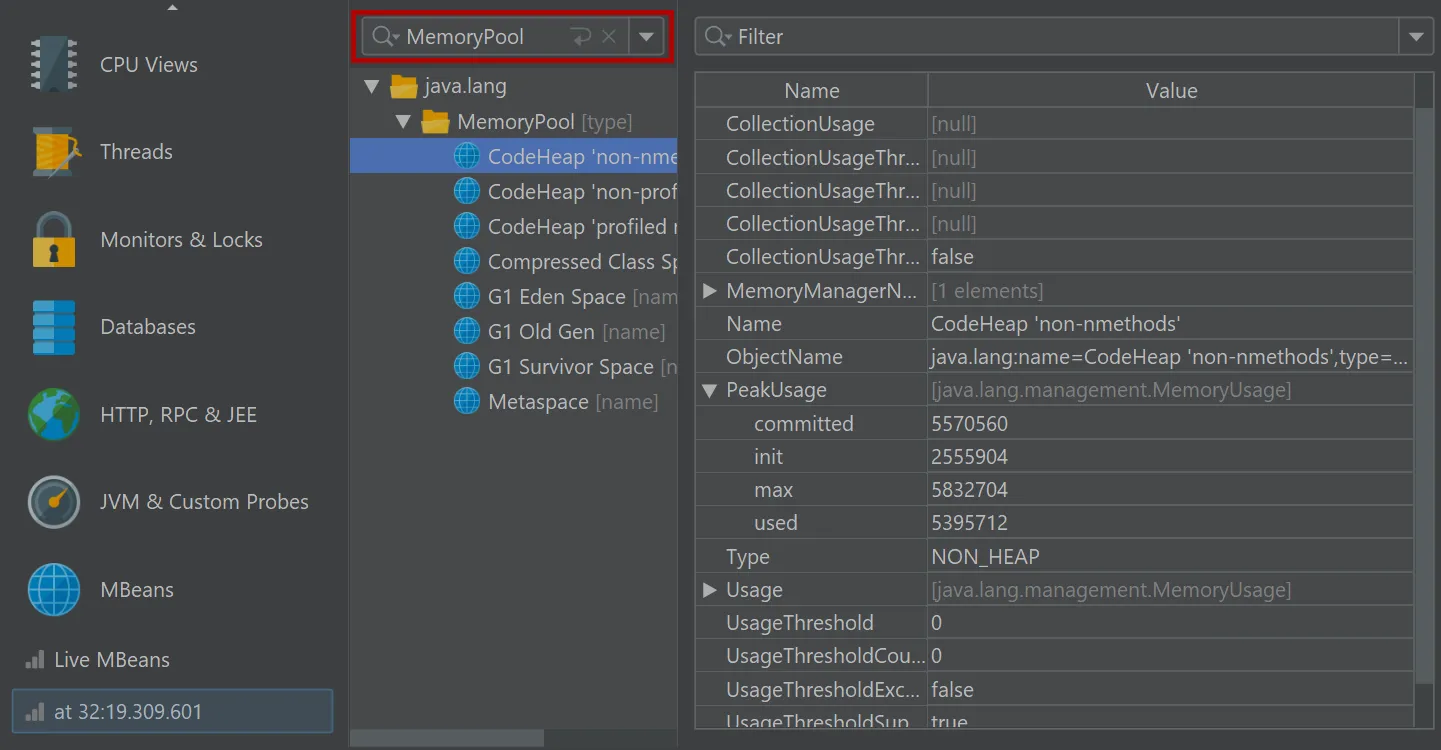
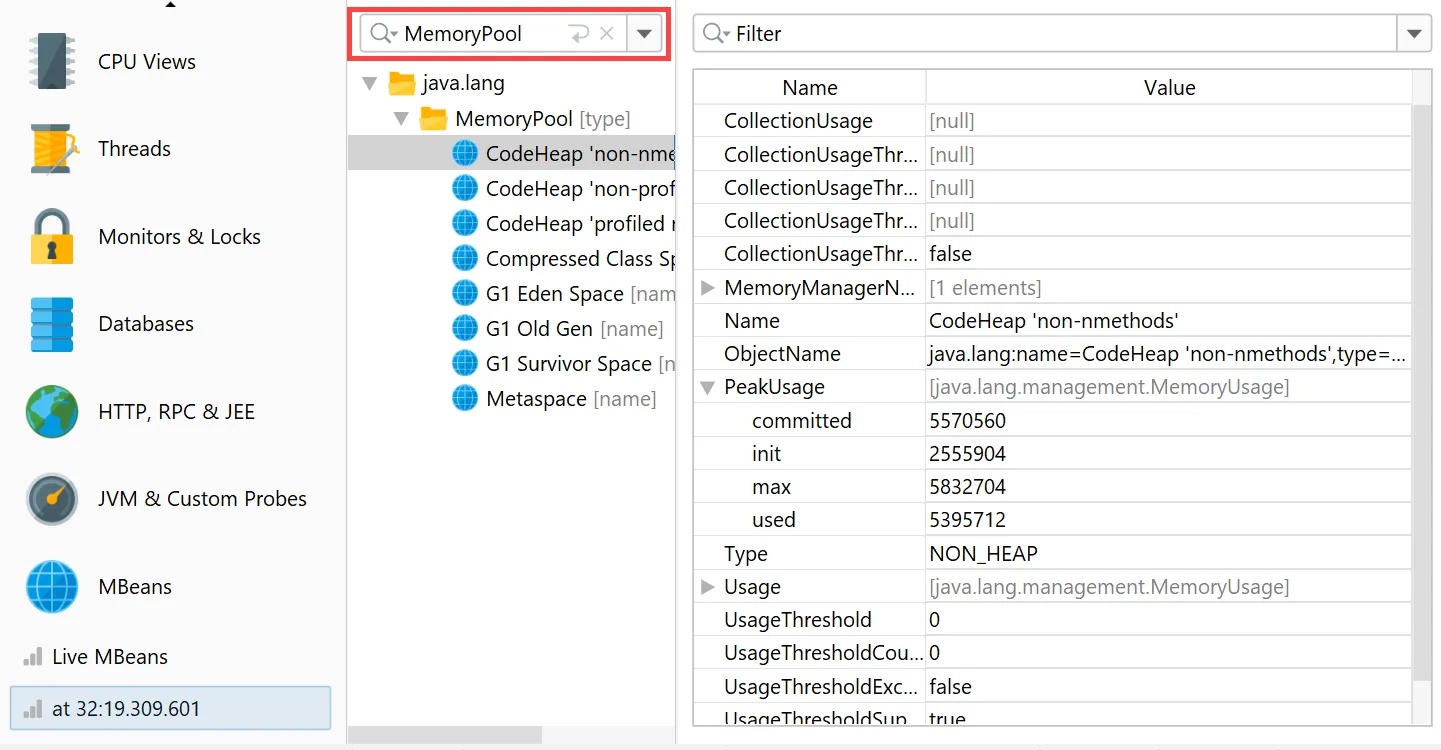
JProfiler can now take MBean snapshots. This is especially useful if you save JProfiler snapshots, either from the UI
or during offline profiling. MBean snapshots enable you to use the MBean browser when JProfiler is not attached to the live JVM.
In live mode, the "MBean snapshot" action in the toolbar creates a new snapshot that is then shown in the view selector. You can take
multiple snapshots and switch between them.
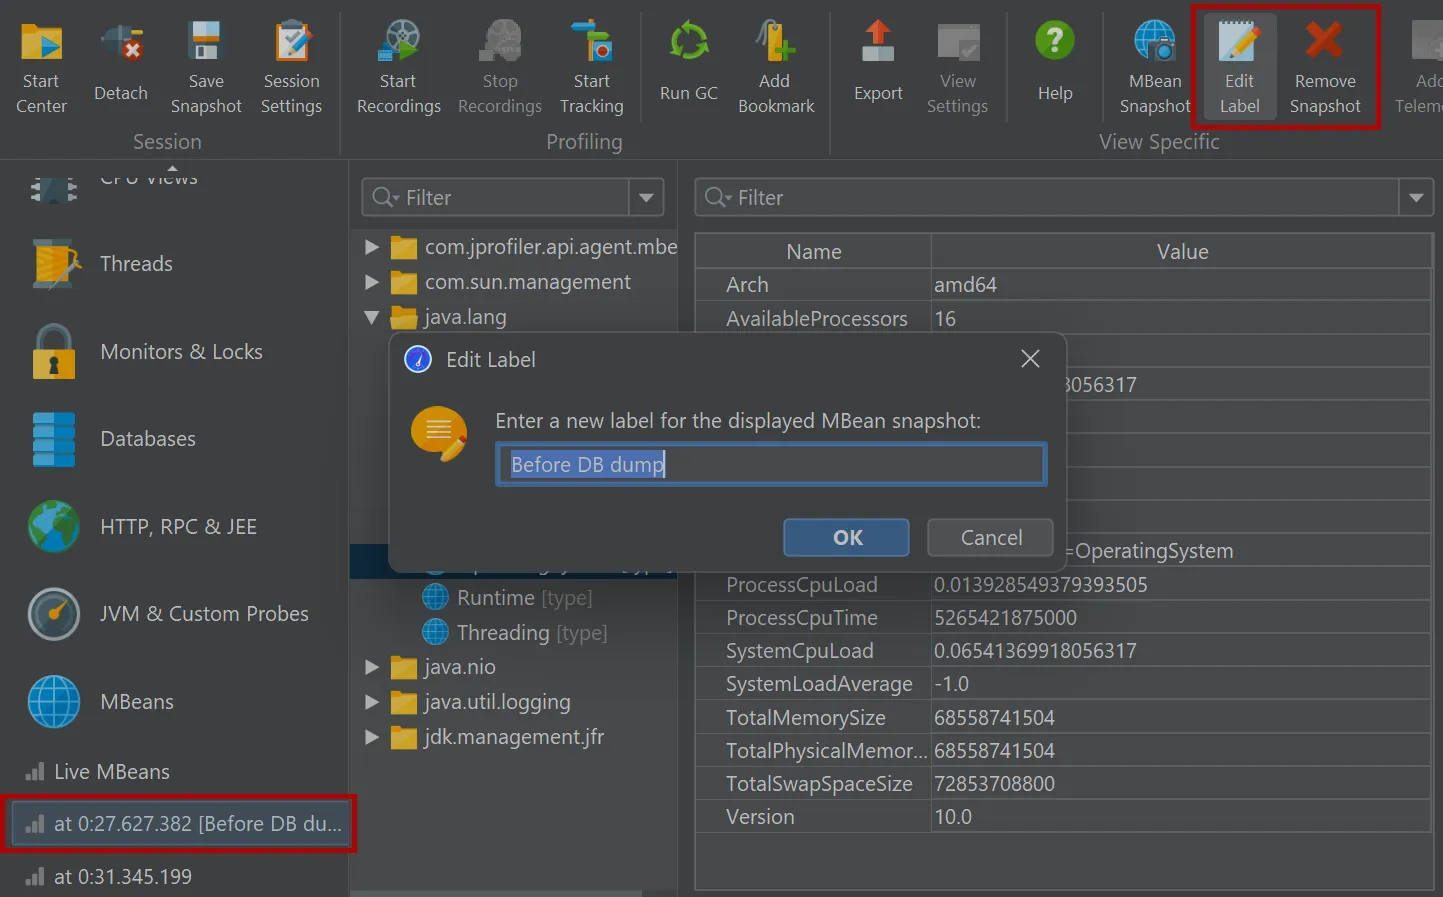
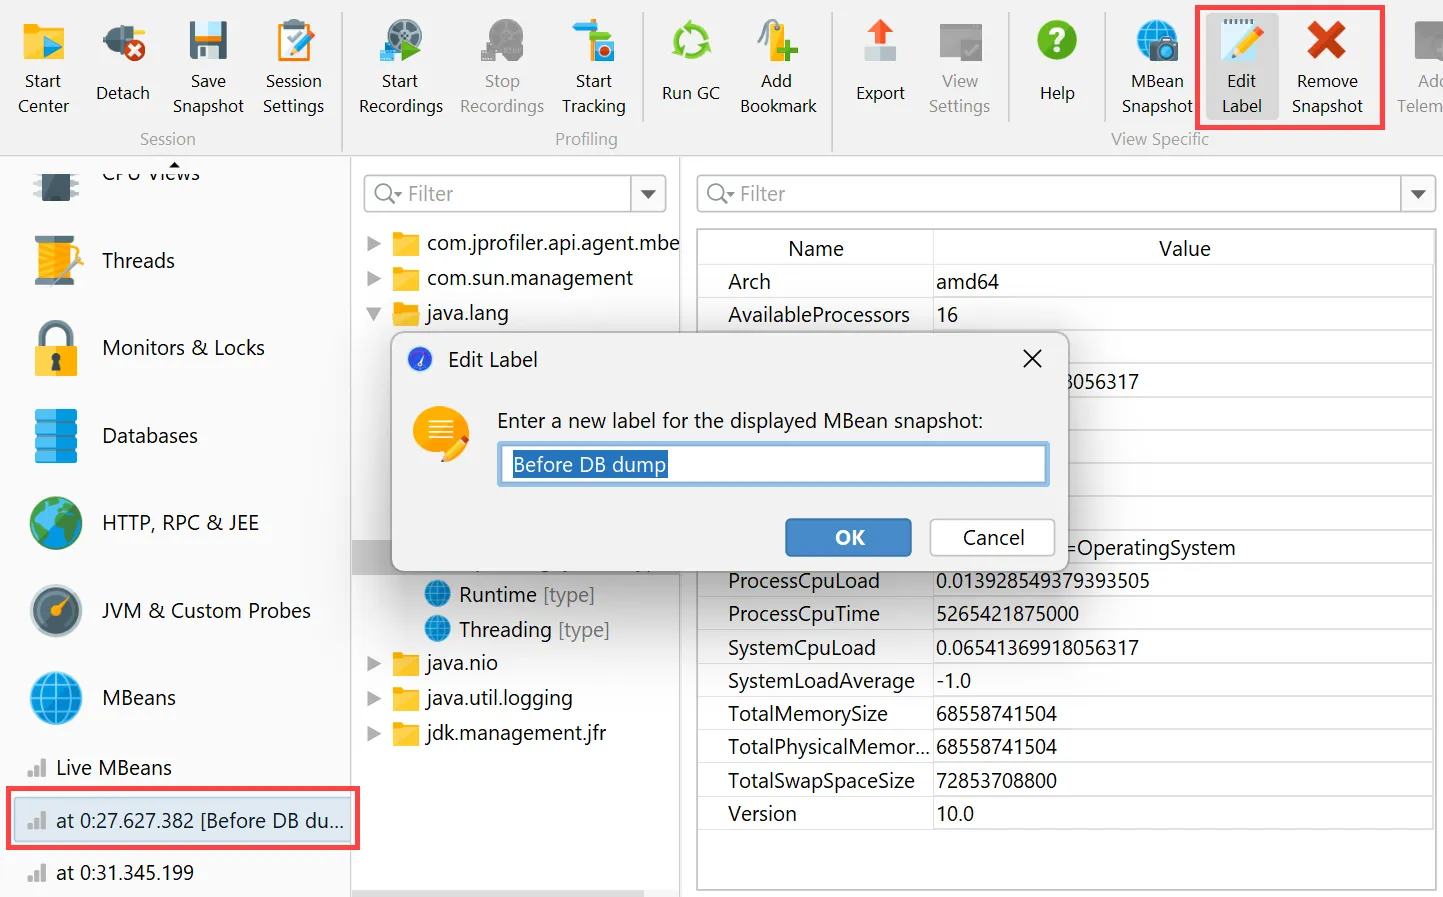
MBean snapshots can be assigned labels that are displayed in the view selector. Unwanted MBean snapshots can also be removed again.
When you take an MBean snapshot, a bookmark is added to all views that have a time axis.
If you set a filter for the displayed MBeans, only the displayed subtrees will be included in the snapshot.
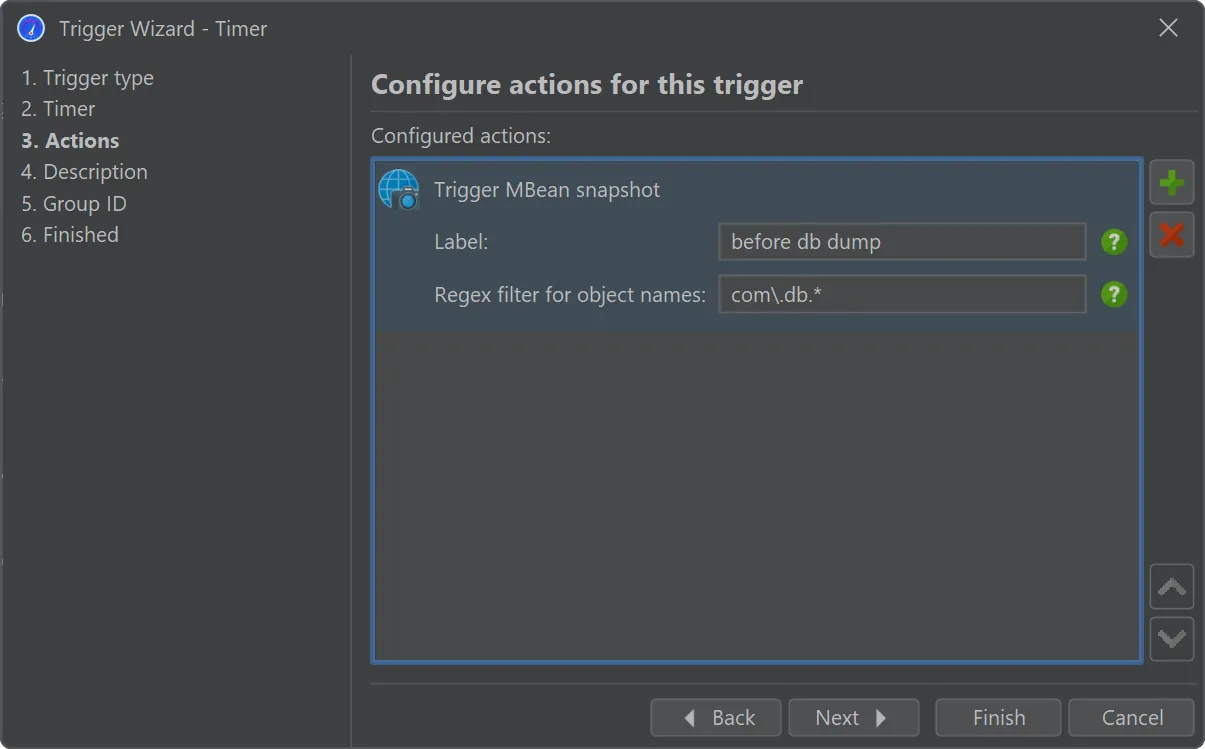
In the MBean snapshot trigger action, you can set a label as well as a filter for the included MBeans as well.
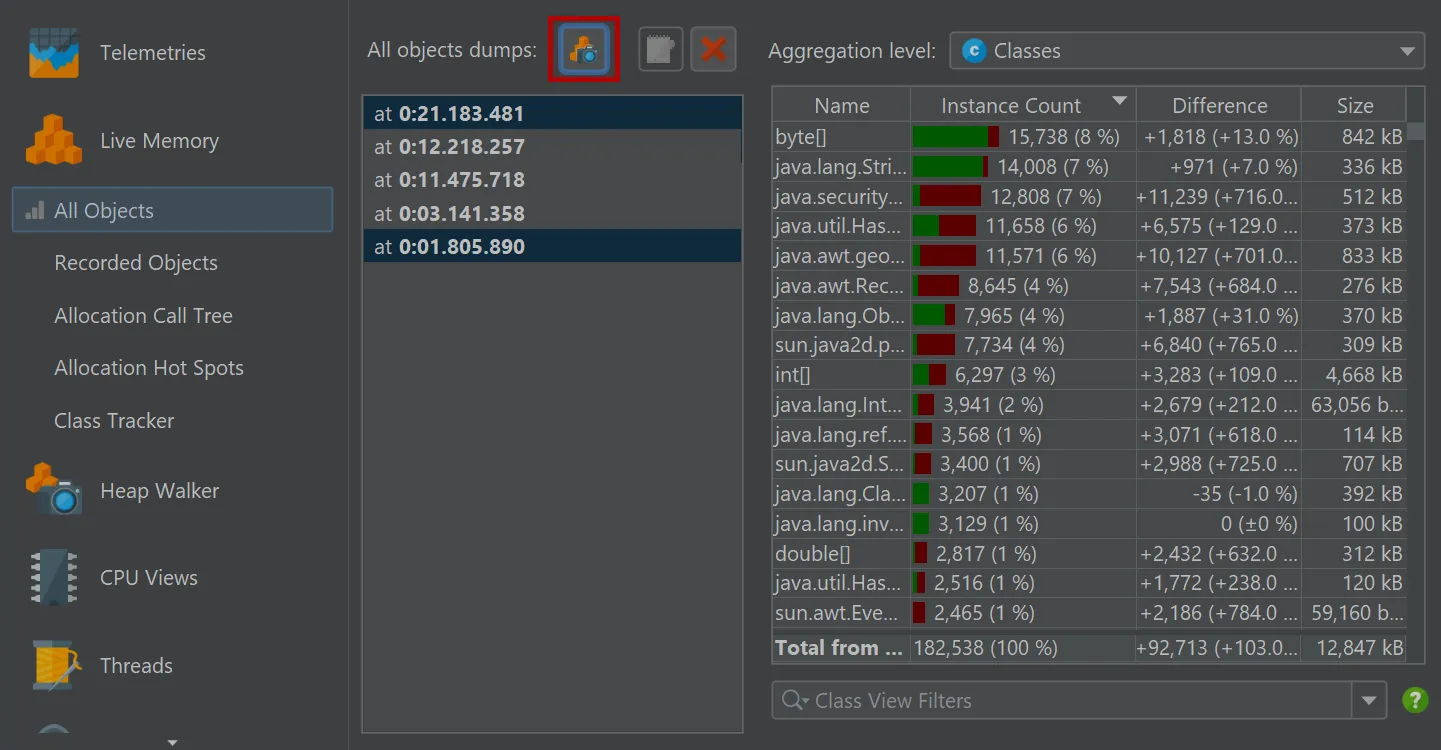
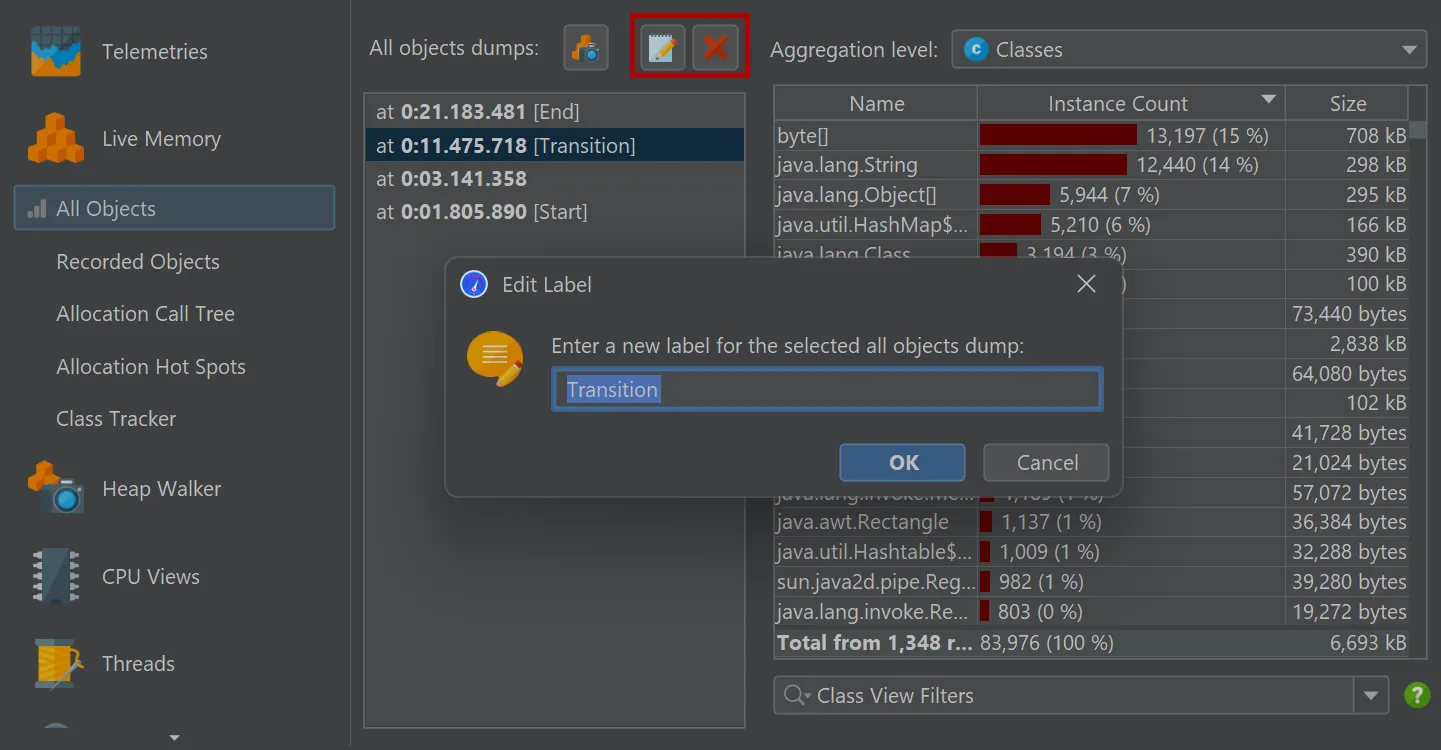
You can now take multiple "all objects" dumps.
The "All objects" view now has an action to take snapshots of the class histogram for all objects on the heap.
When two dumps are selected, the differences are shown in the view.
The toolbar above the dump selector offers actions to label and remove selected dumps.
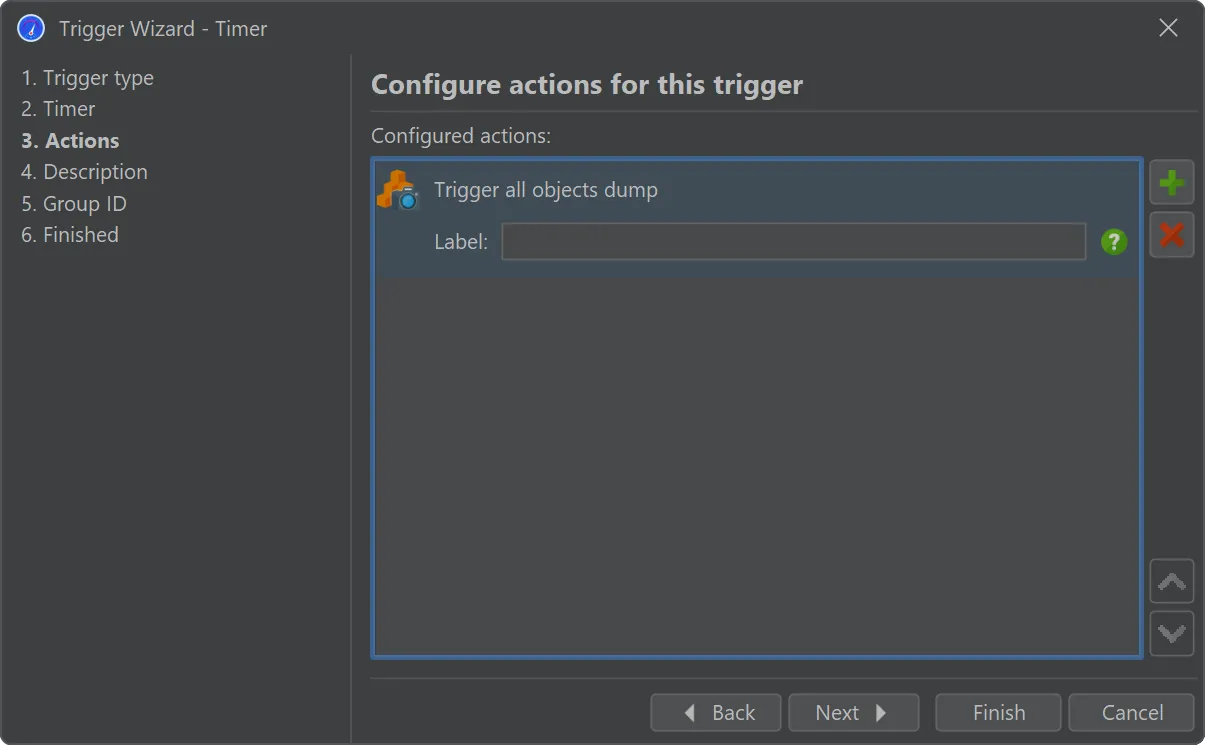
A trigger action has been added to take all object dumps programmatically, either in live mode or during offline profiling.
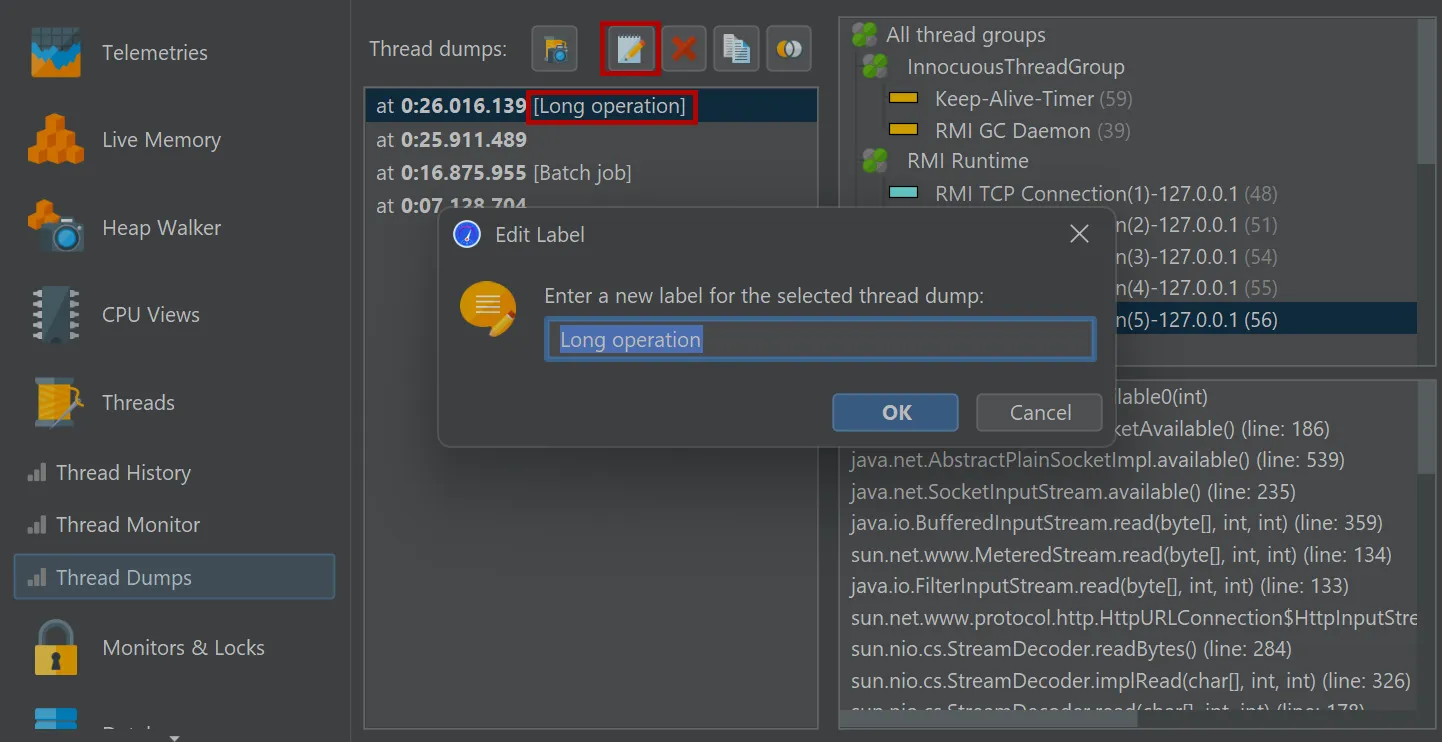
On a related note, it is now possible to label dumps in the thread dumps view as well.
This can also be done via the trigger action and the Controller API.
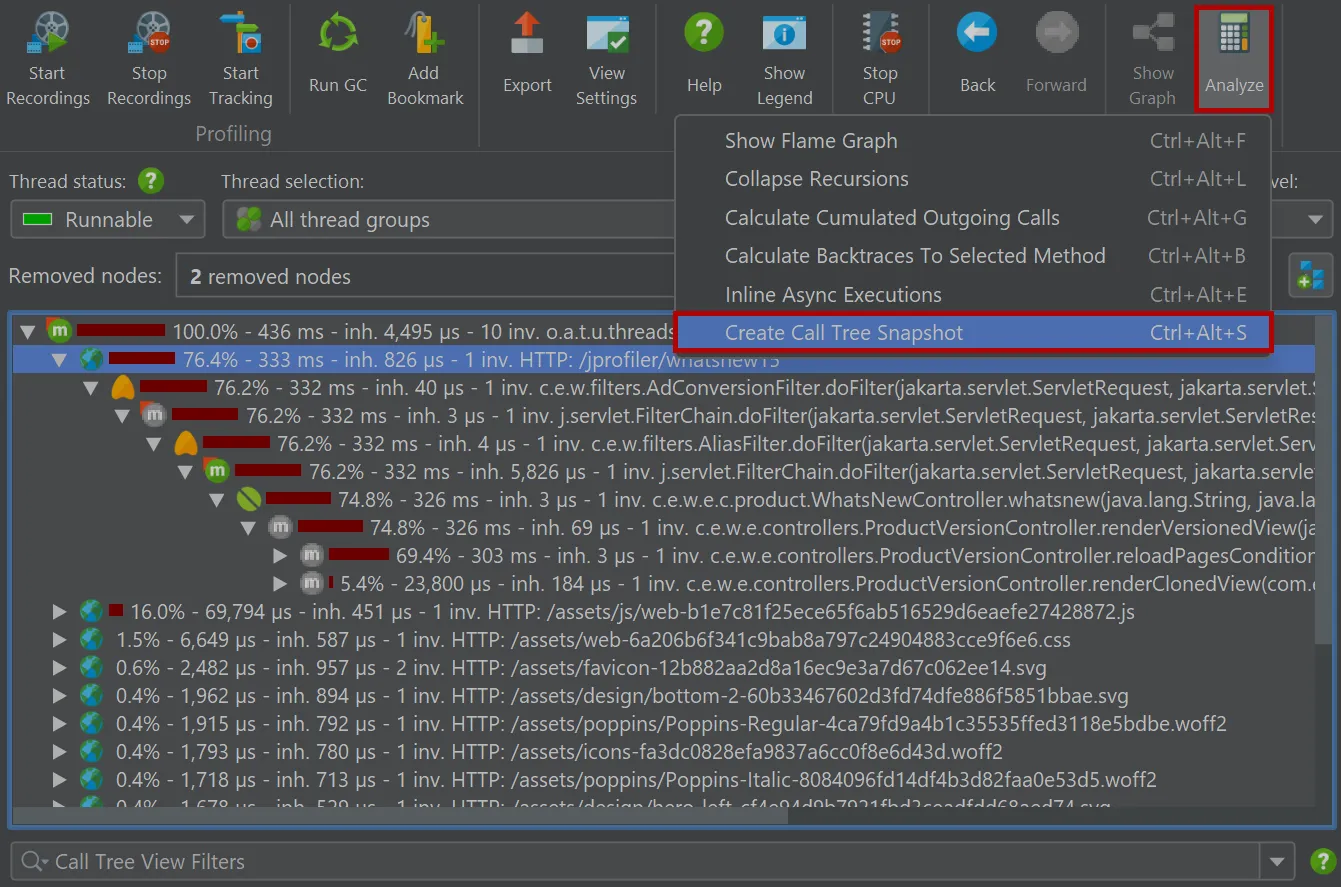
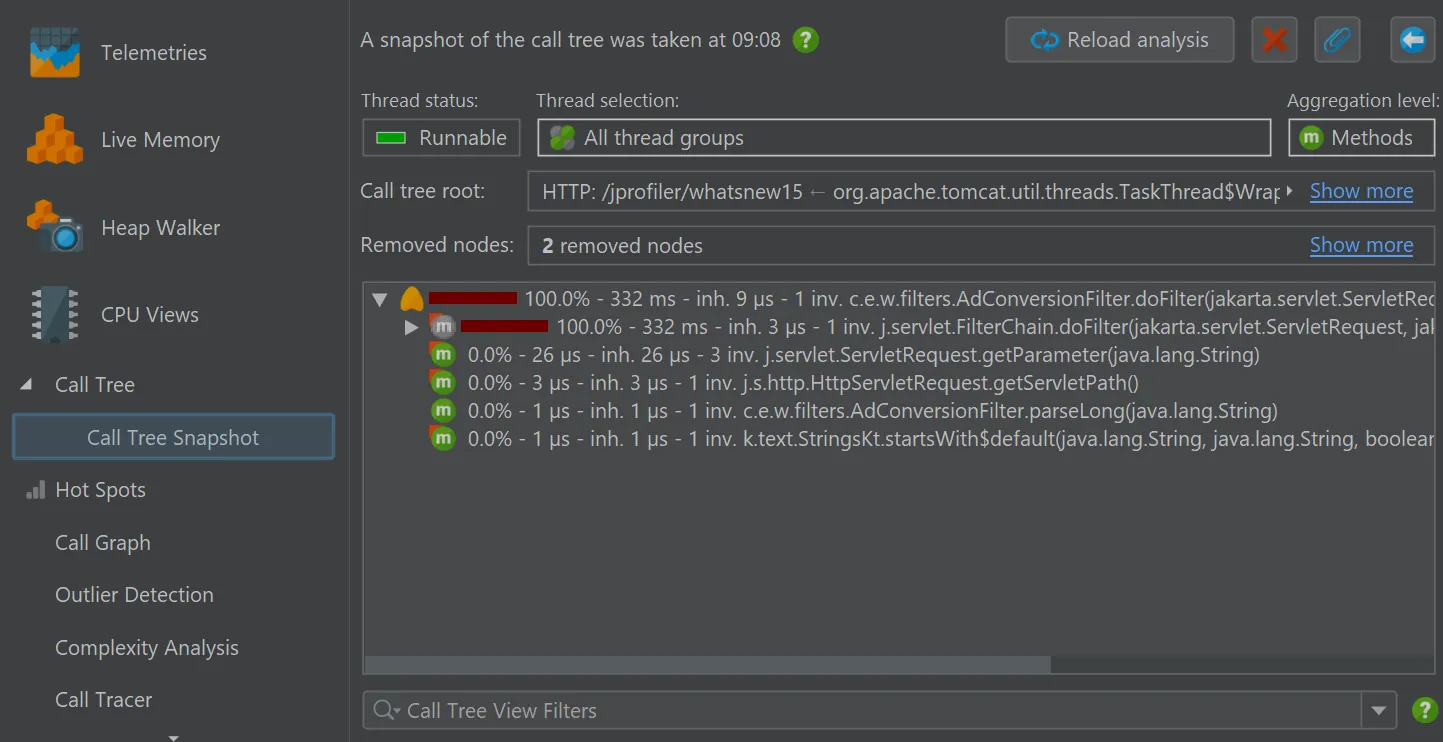
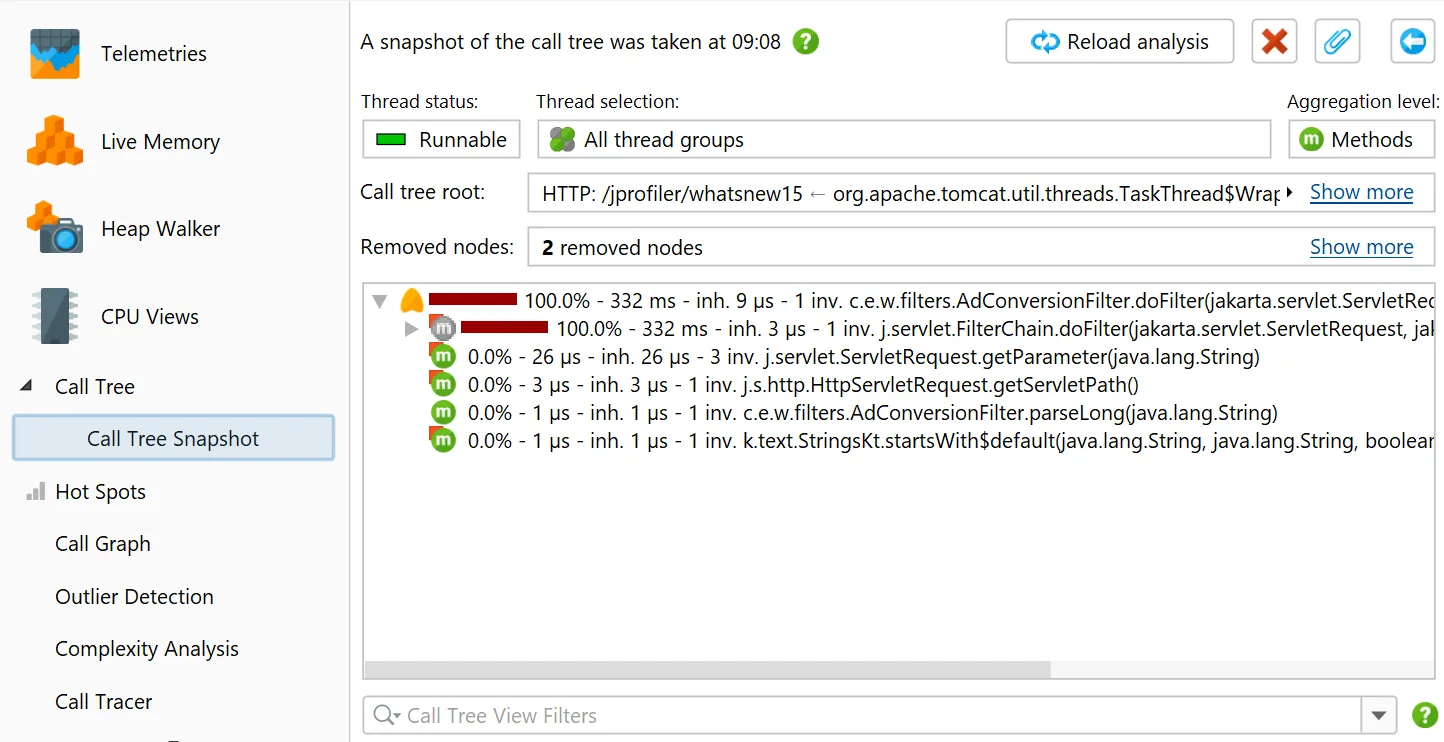
You can now make snapshots of the "Call tree" view in the CPU section.
For that purpose, a "Call tree snapshot" action has been added to the call tree analyses drop-down.
It creates a new call tree analysis view below the main call tree view that shows a static copy of the selected root, or the entire
call tree if no node was selected. All other view parameters like thread status or aggregation level are fixed in the call tree snapshot.
Unlike other call tree analyses, call tree snapshots are saved into JProfiler snapshots, because they contain separate data.
With this tool, you can manage different call tree recordings without resorting to saving full snapshots that you have to open in
different JProfiler windows. Instead, you can remain in the same live session and keep different sets of recording data around.
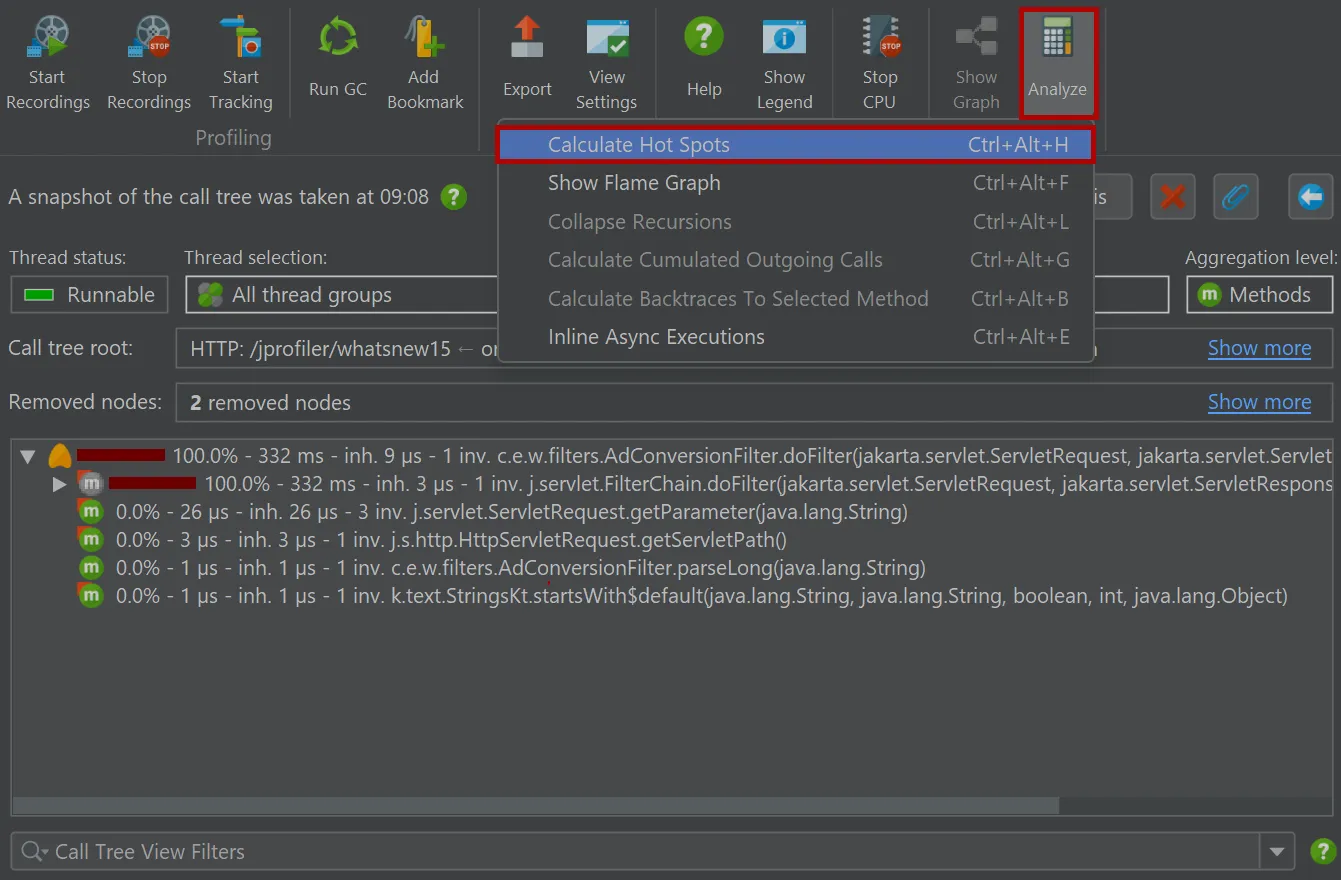
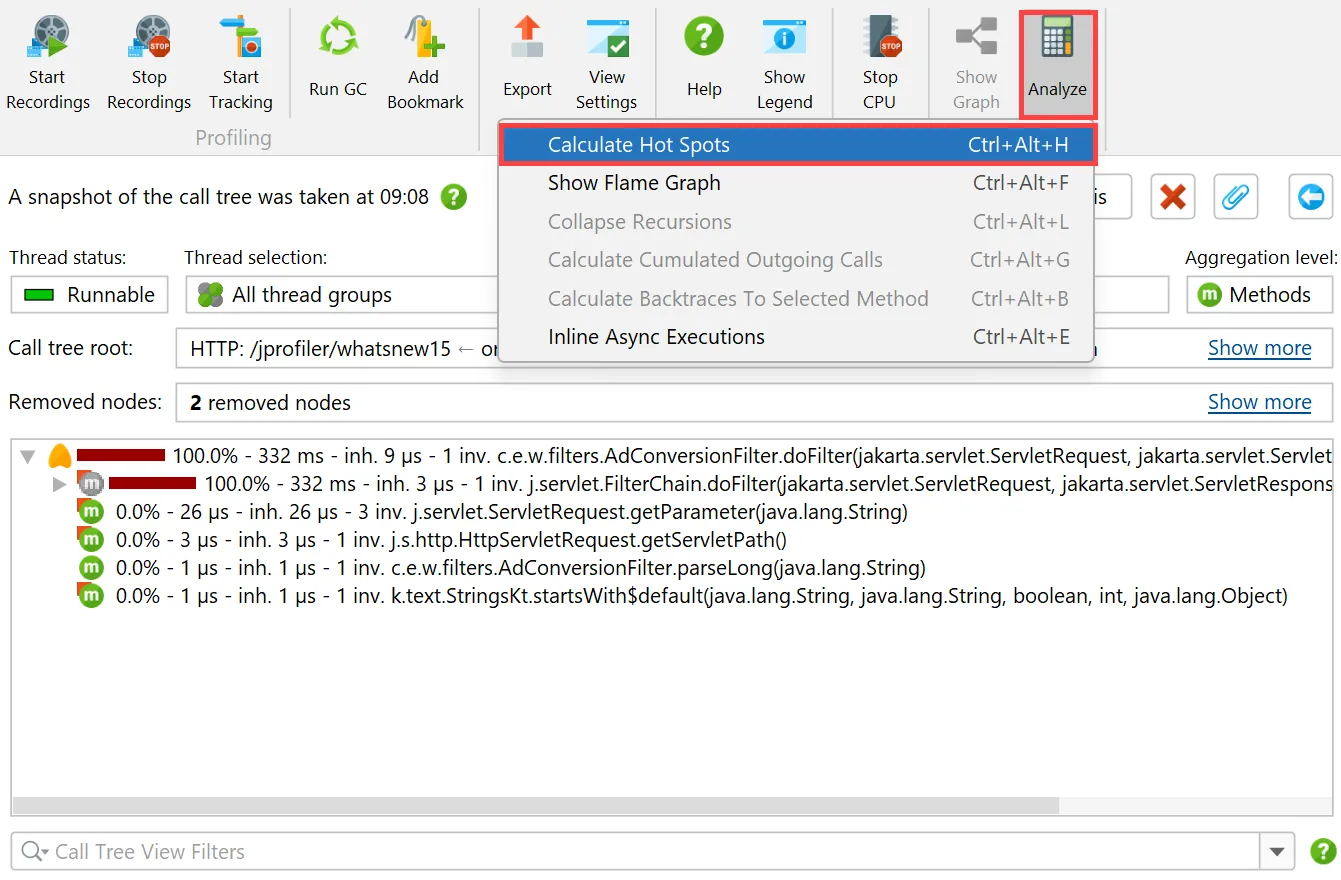
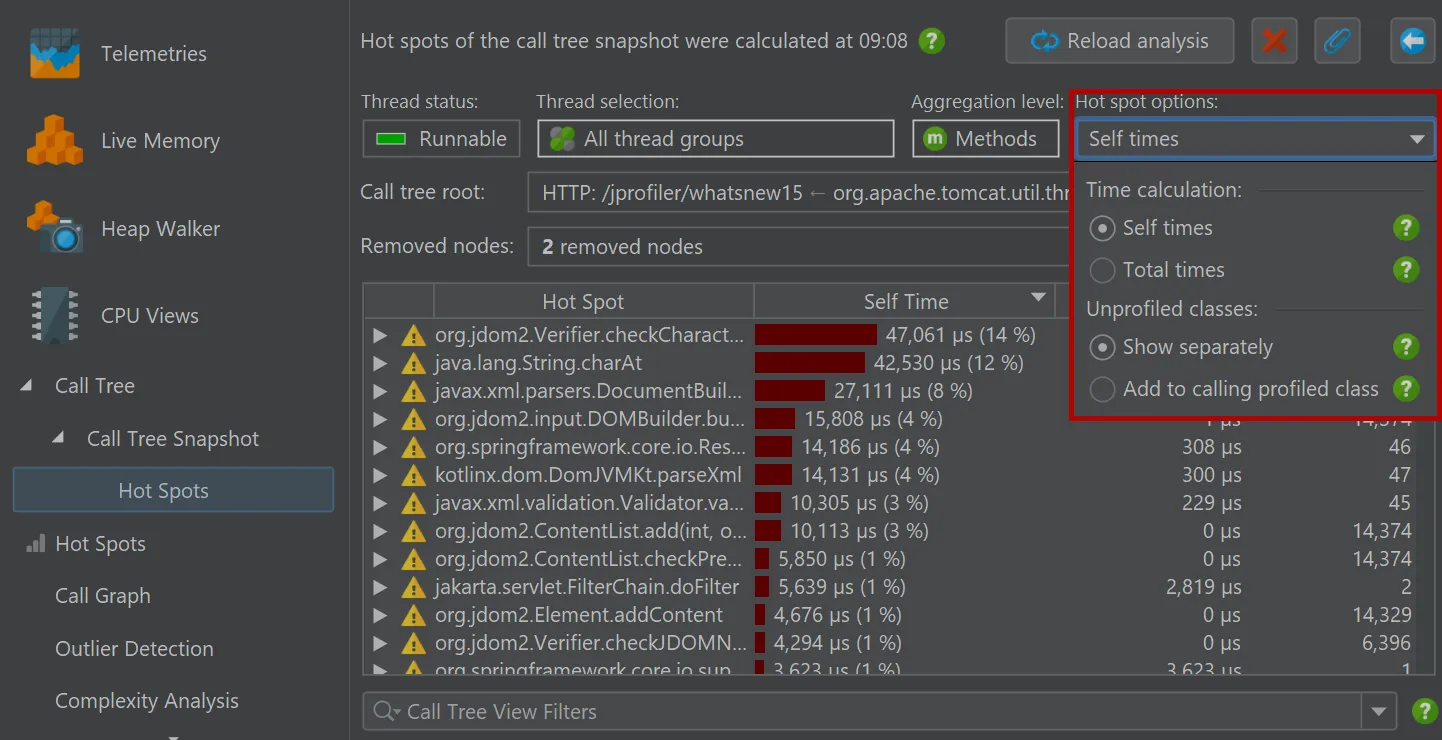
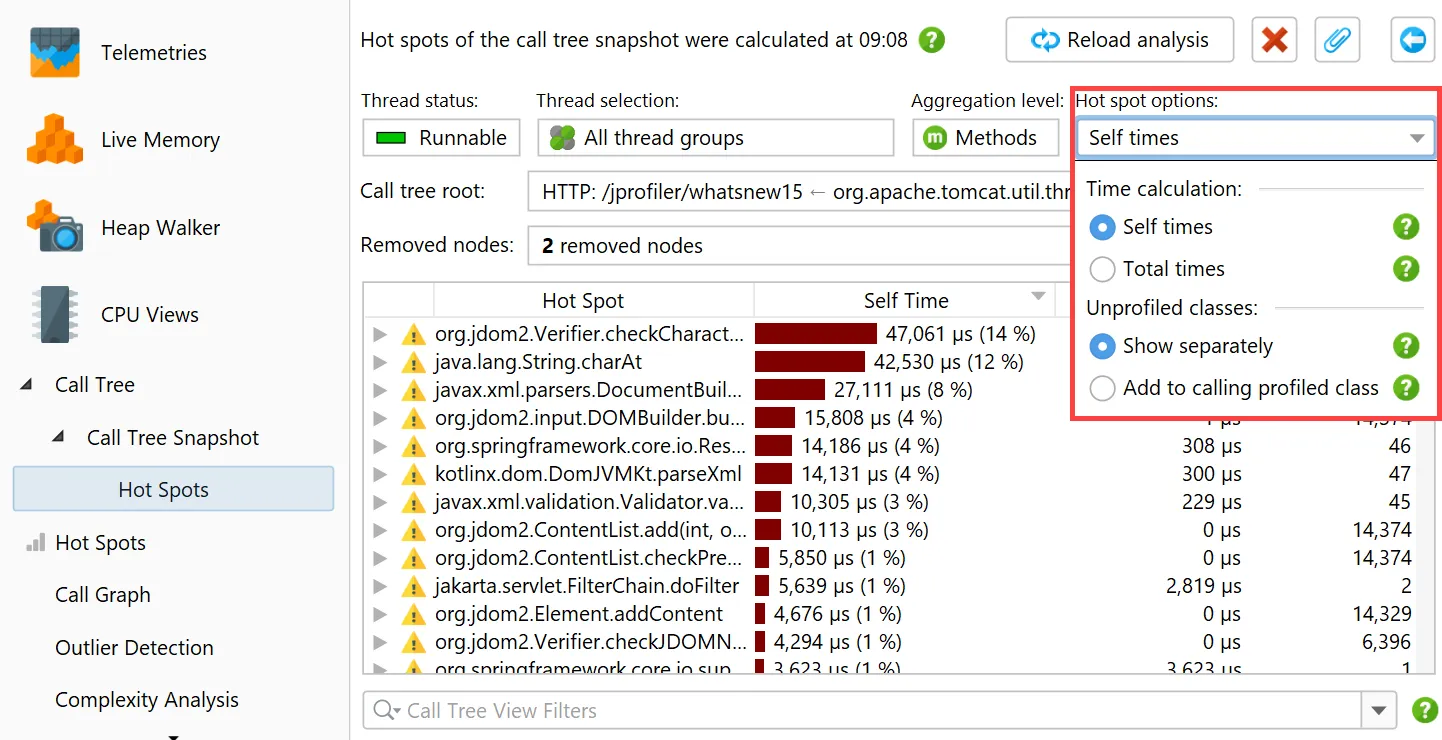
In the call tree snapshot view, a "Calculate hot spots" analysis action is available besides the usual call tree analysis types.
The resulting hot spot view is added as a child of the call tree snapshot view and shows the static hot spots for the data in the parent
view. The hot spot calculation options are still adjustable here.
Call tree analyses have been improved.
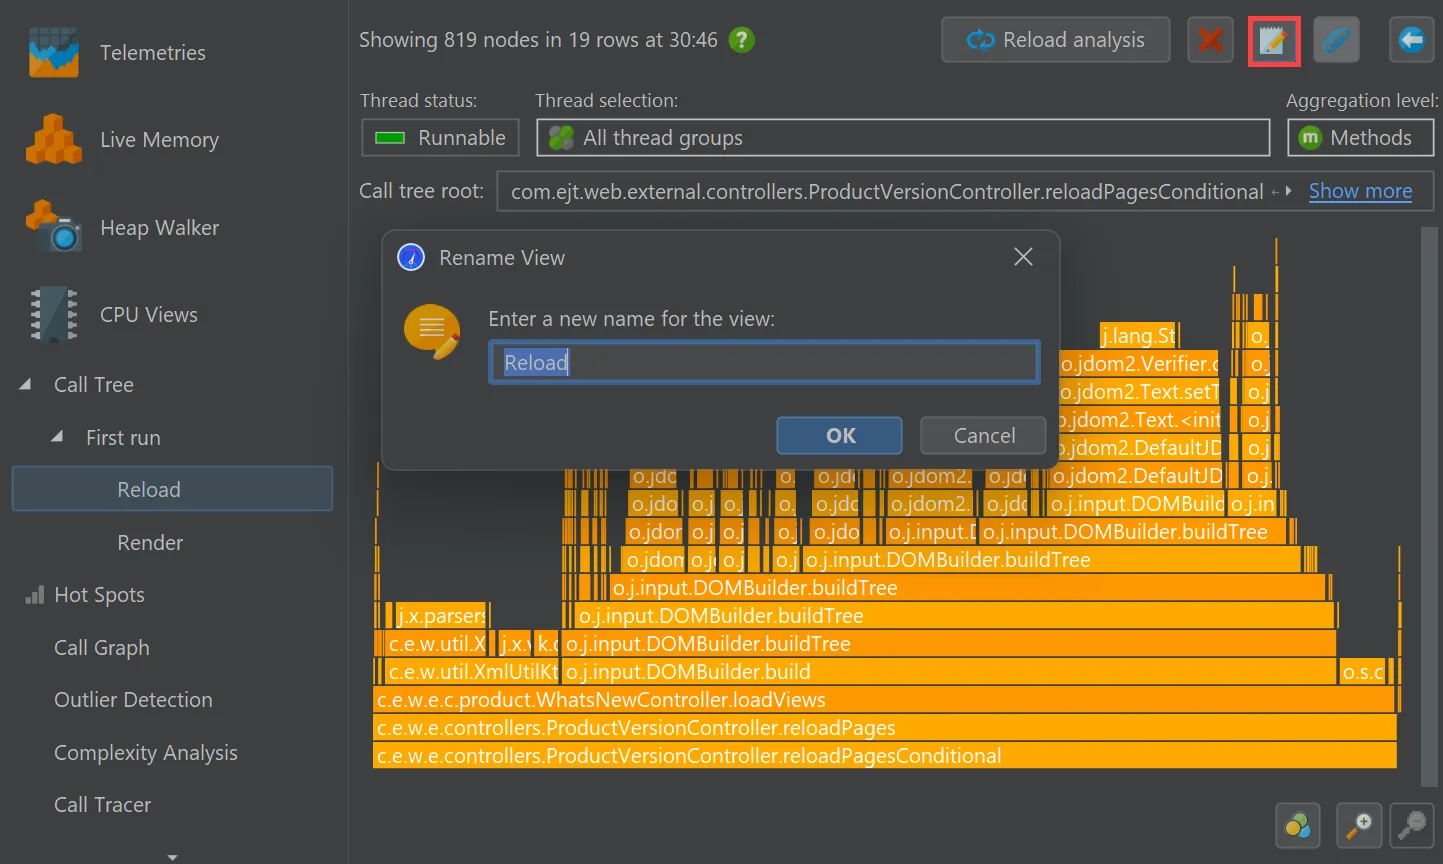
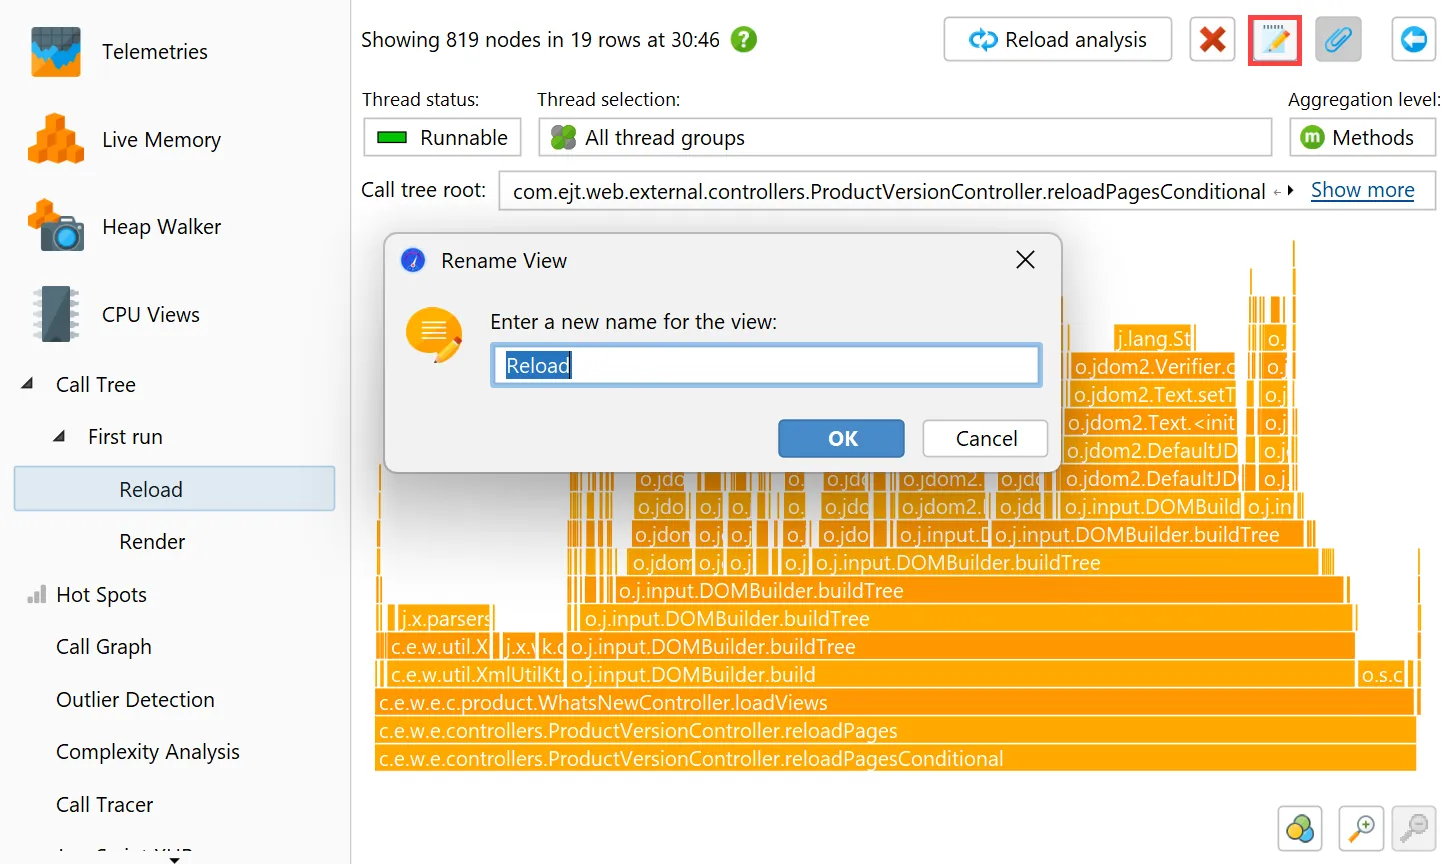
You can now rename call tree analyses. After making them permanent with the pin button, a rename button will appear that changes
the name of the analysis in the view selector.
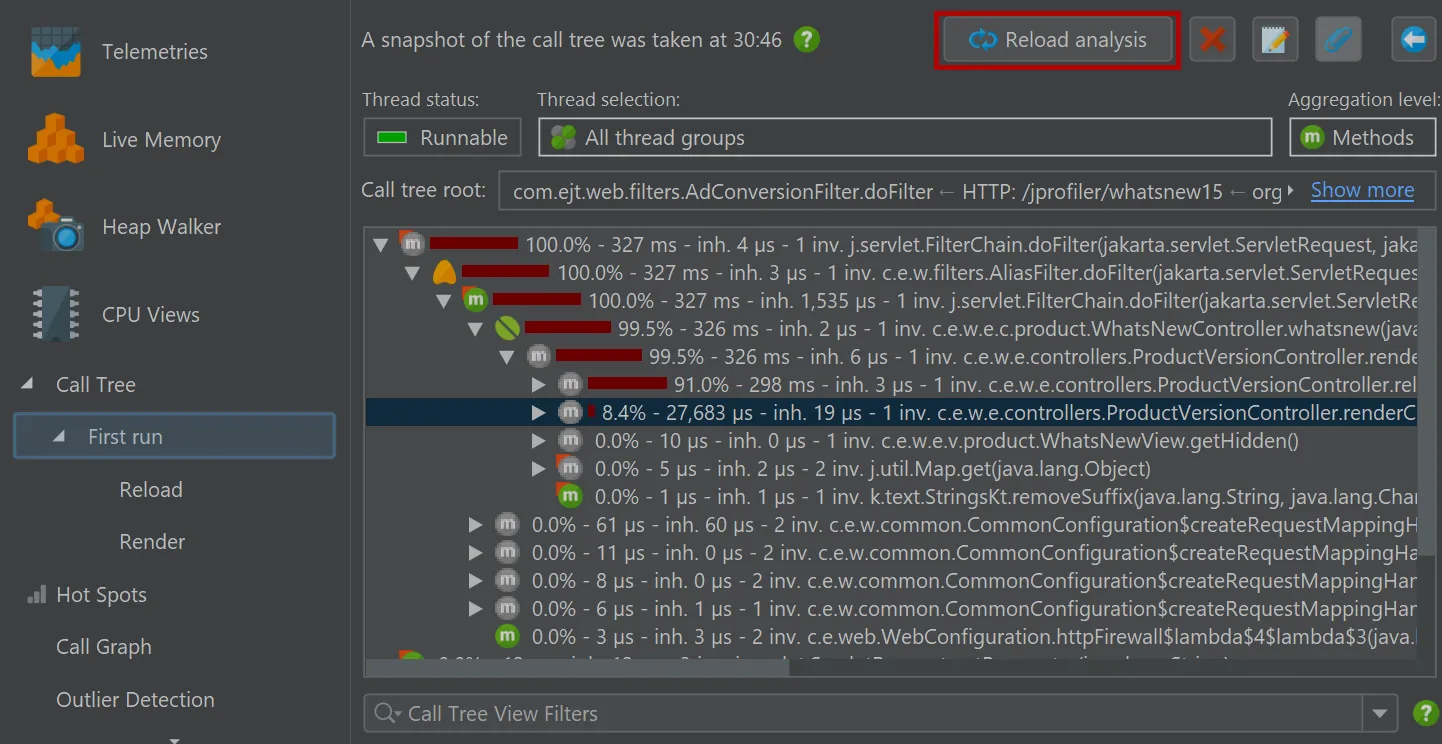
In addition, the "Reload analysis" button goes back to the top level ancestor view and re-calculates all ancestor views
and all descendant views for the new data. In the example below, the current data in the live call tree would be used to update the
call tree view labeled "First run" and then the flame graph views labeled "Reload" and "Render".
Heap walker filter and grouping scripts on dumped data have been added.
Previously, only filter and grouping scripts on live objects were available which did not work for snapshots. Also, changing data
and garbage collection of objects may require operations on dumped data instead of live data.
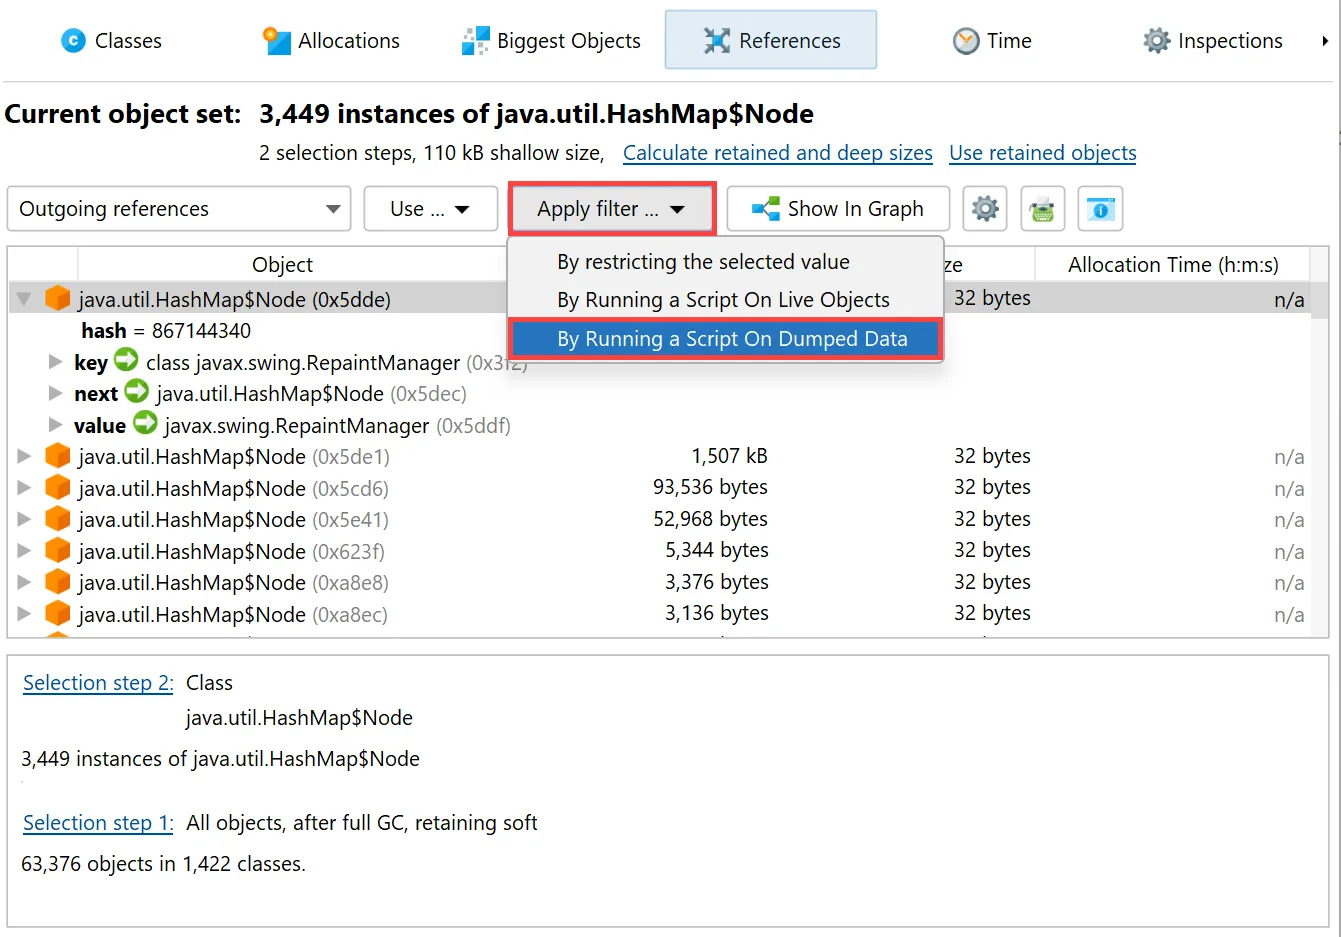
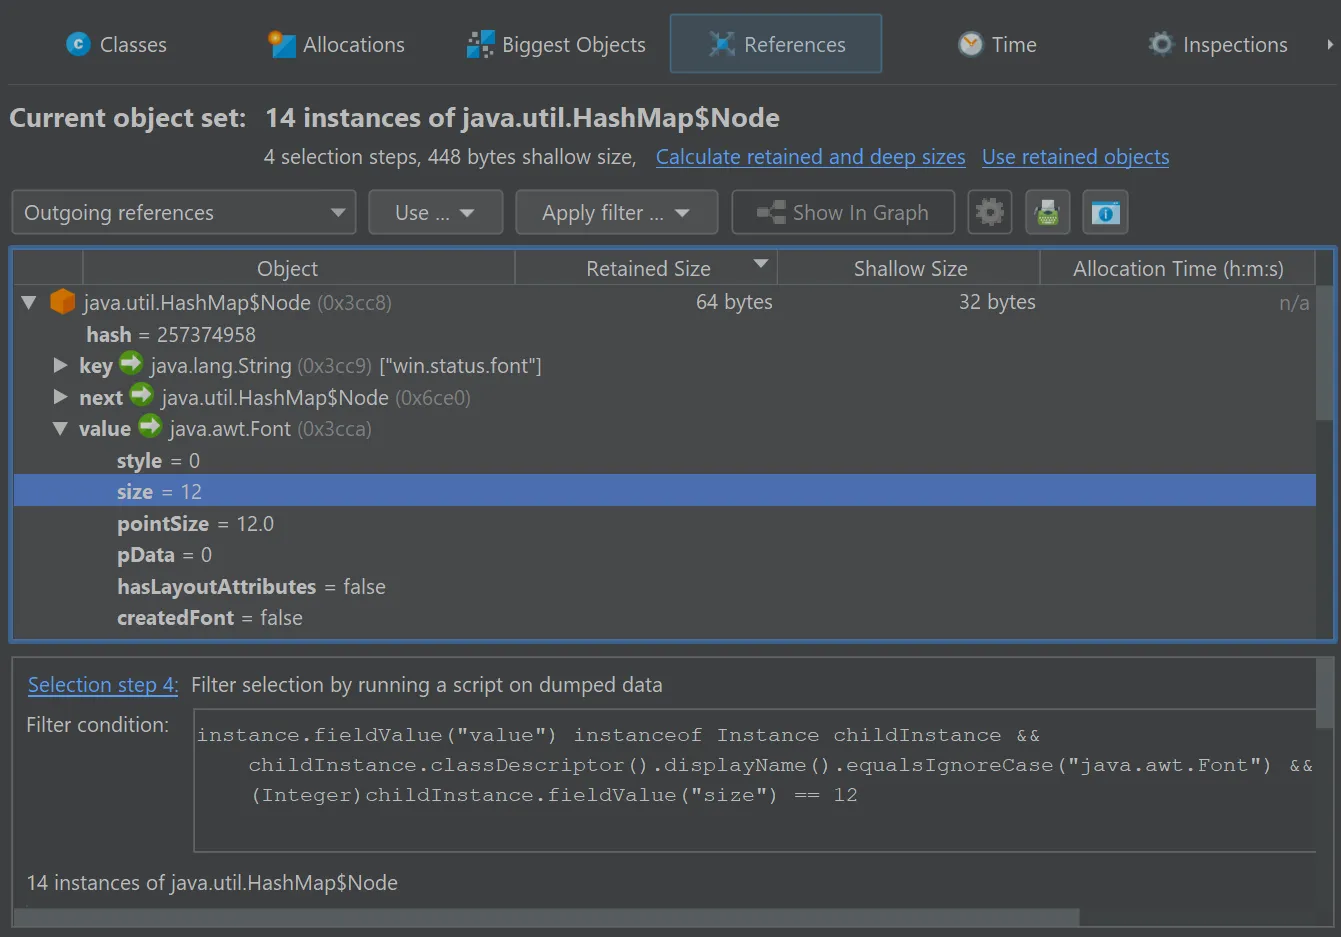
In the references view of the heap walker, the "Apply filter" dropdown contains a new action to filter objects by running a script on
dumped data.
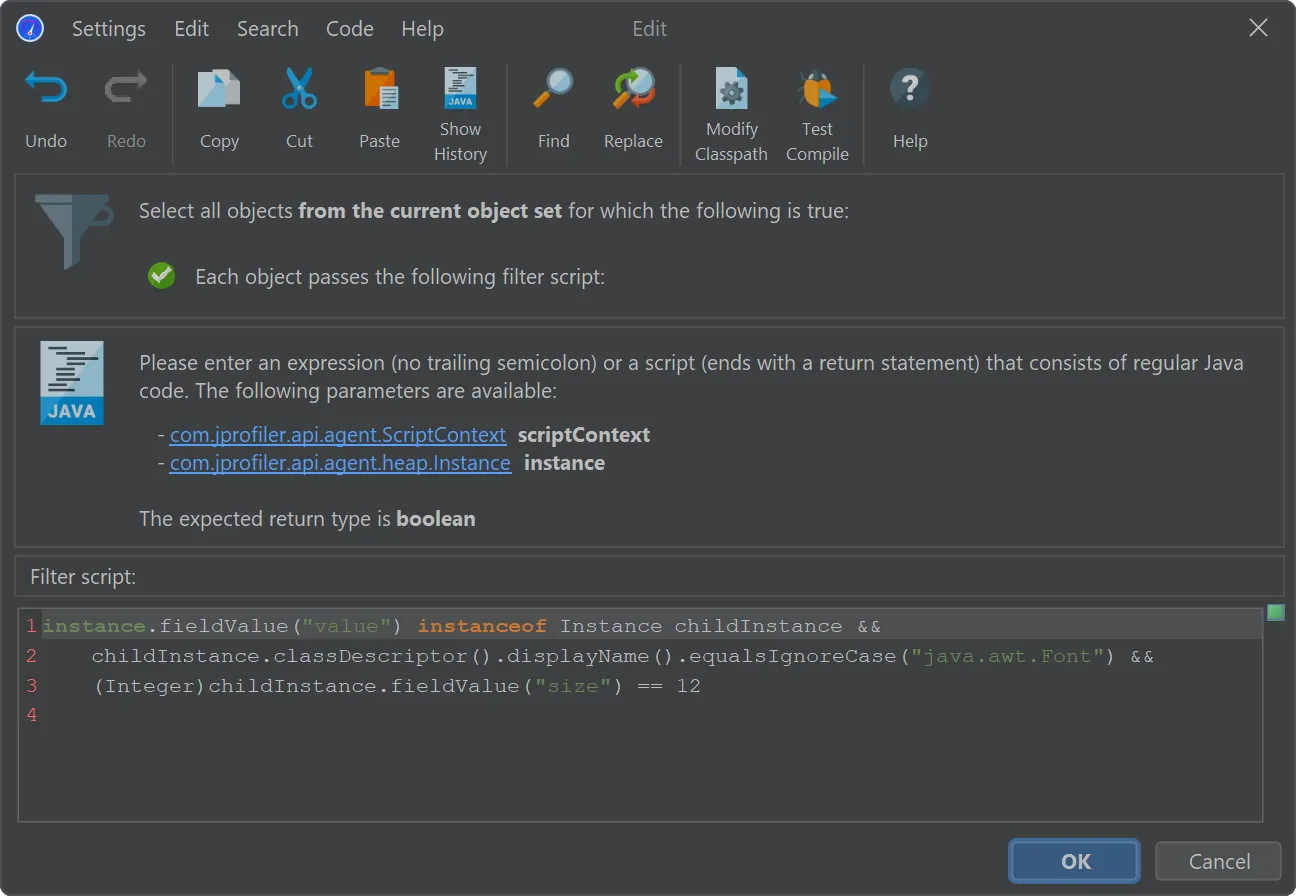
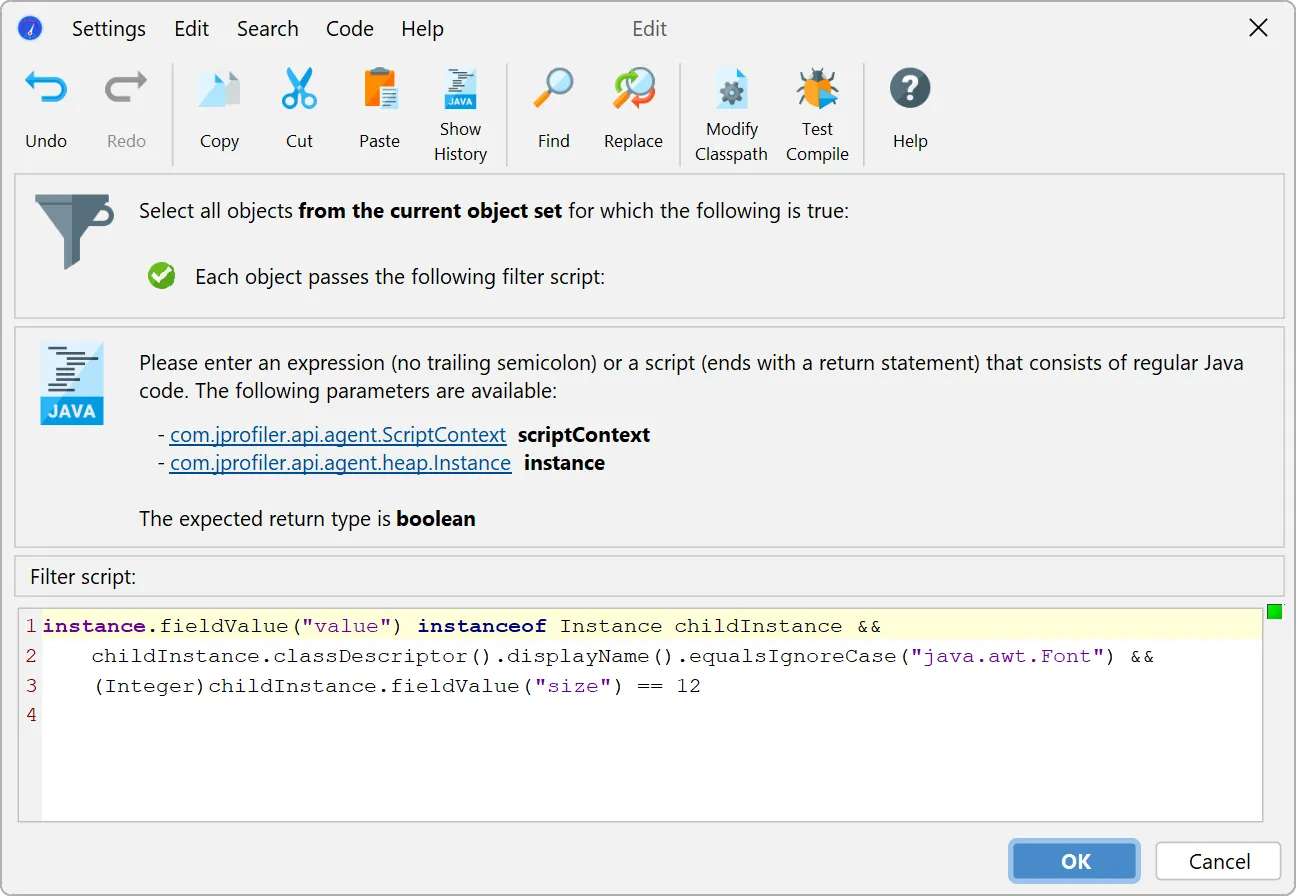
In the script editor, objects from the com.jprofiler.api.agent.heap API are passed as an argument, and the boolean return value
of the script decides whether the object is included in the new object set.
In general, the parameter is of type com.jprofiler.api.agent.heap.HeapObject but can be narrowed to a subtype if the current
object set allows it. In the screenshot below, the current object set only contained java.util.HashMap$Node instances, so the
parameter is of type com.jprofiler.api.agent.heap.Instance which provides access to field values.
The script selects java.util.HashMap$Node instances whose value is a java.awt.Font with a size of 12.
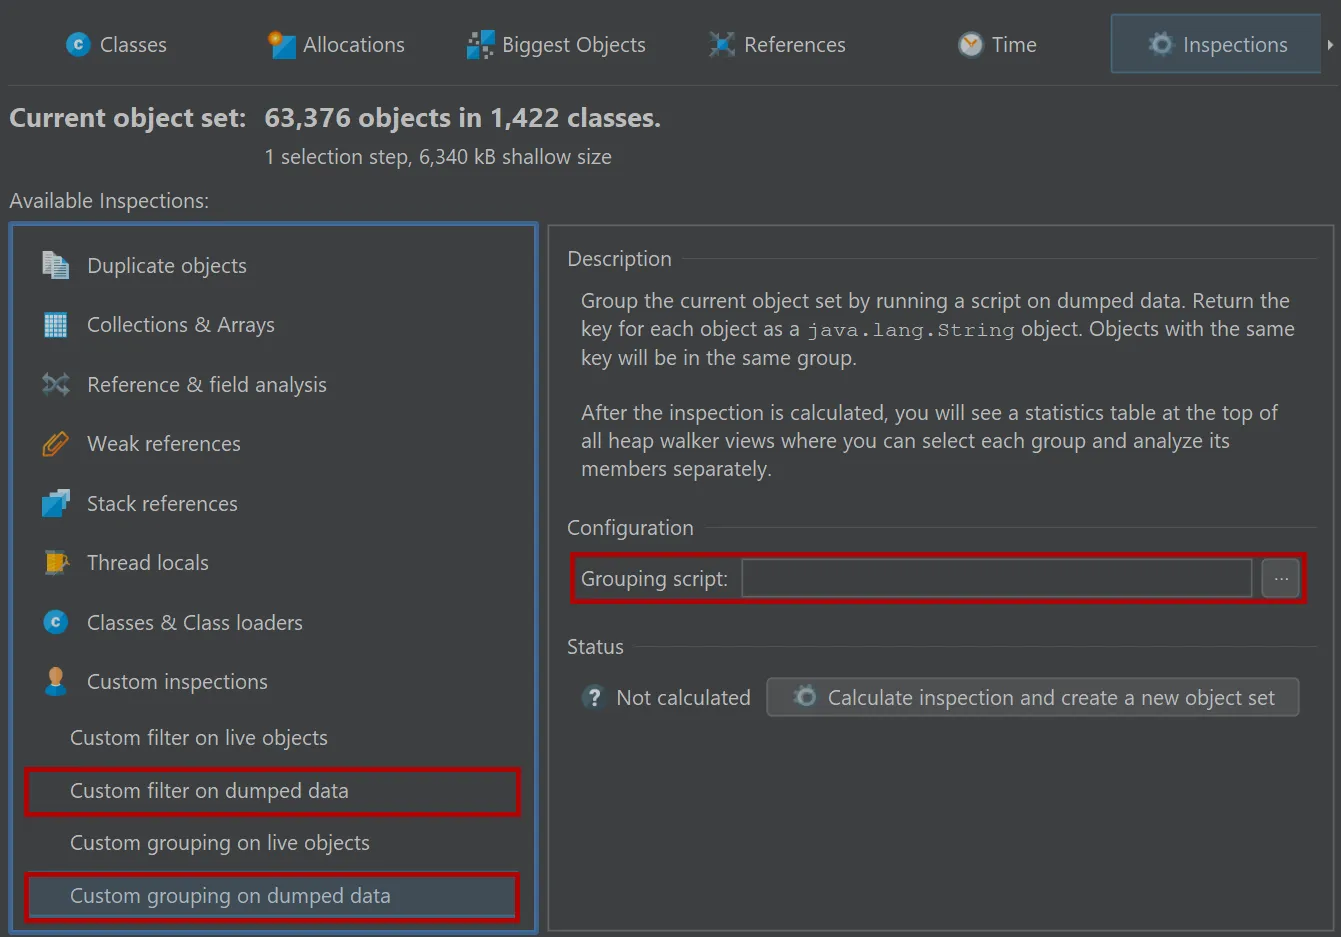
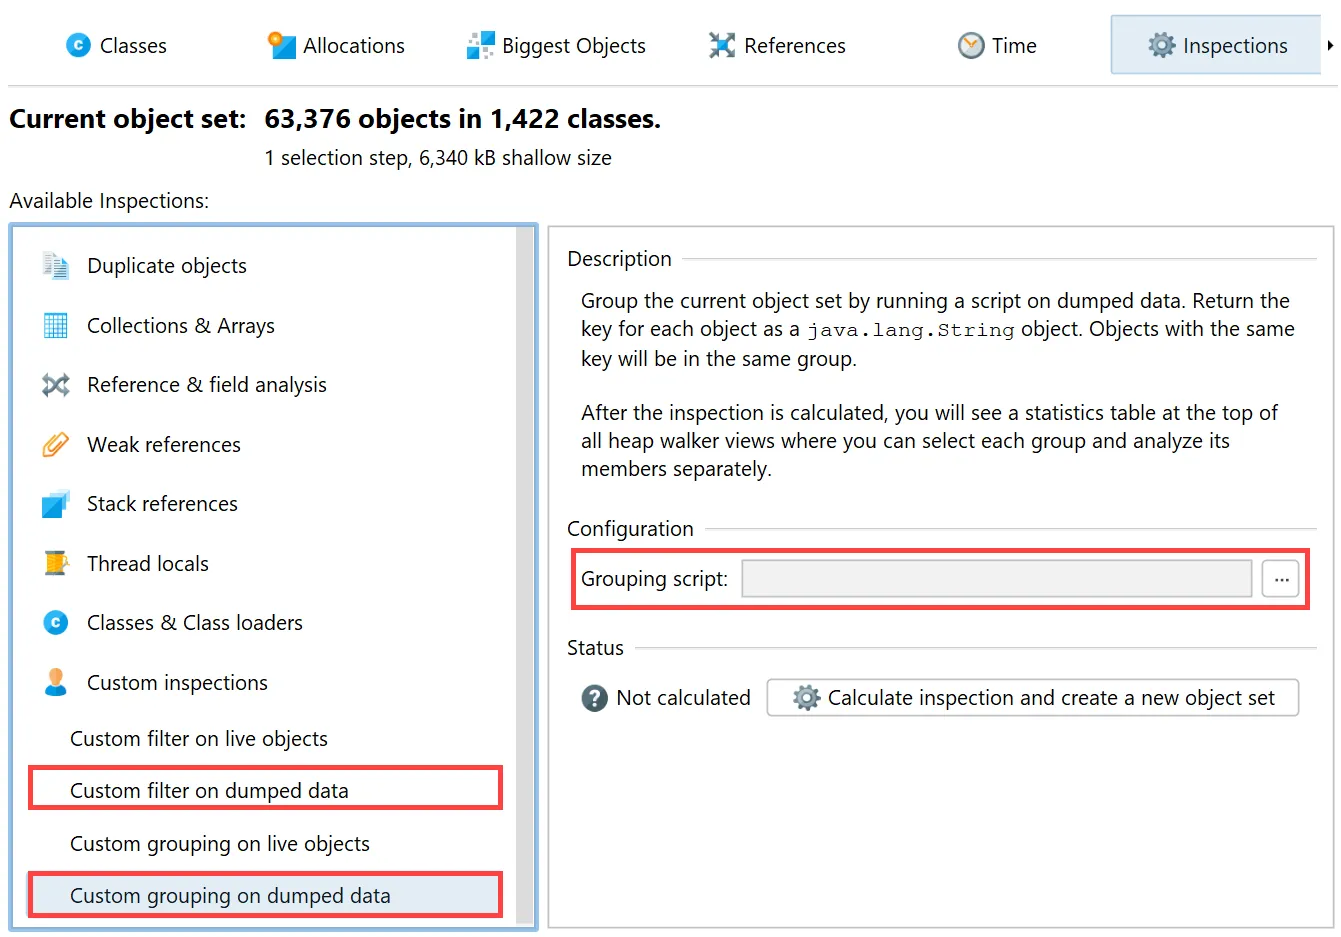
In addition to the filter script in the references view, JProfiler provides an inspection to filter all objects in the current
object set as well an inspection which groups all objects according to the string return value of a script.
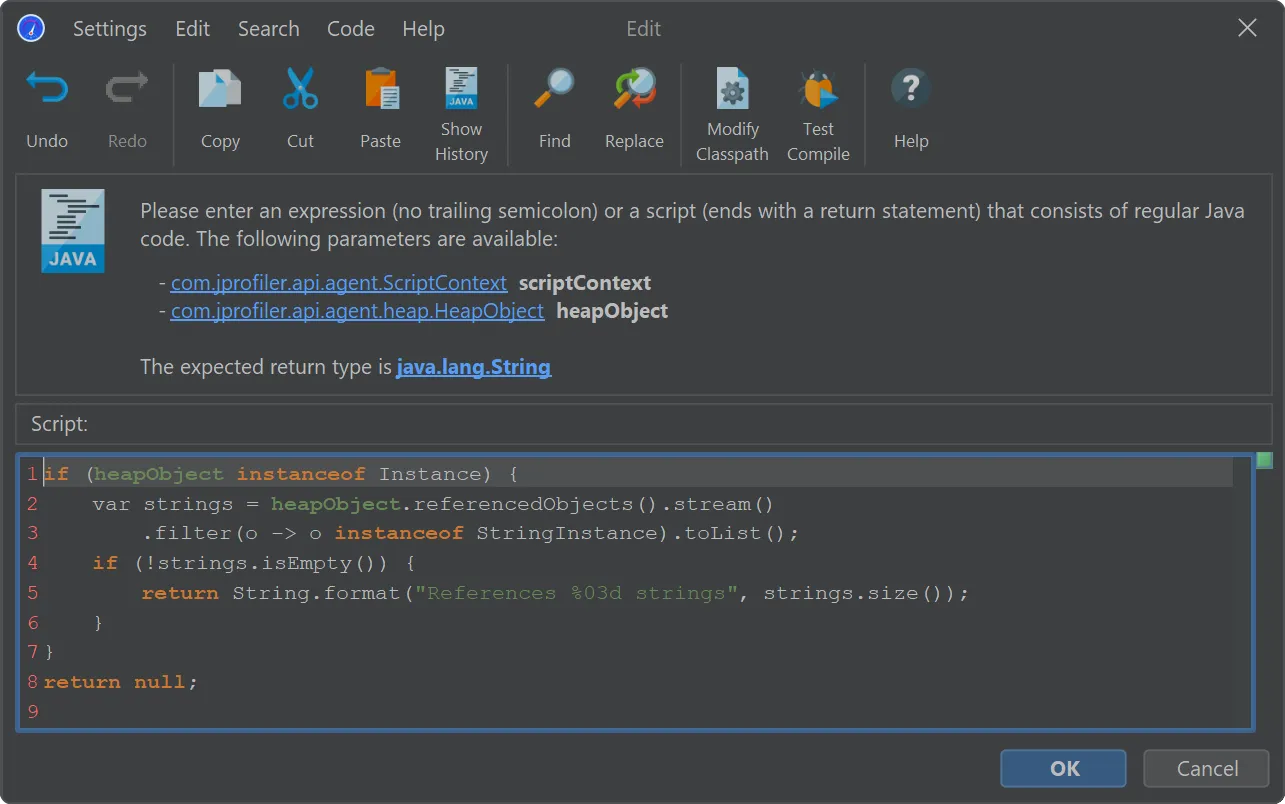
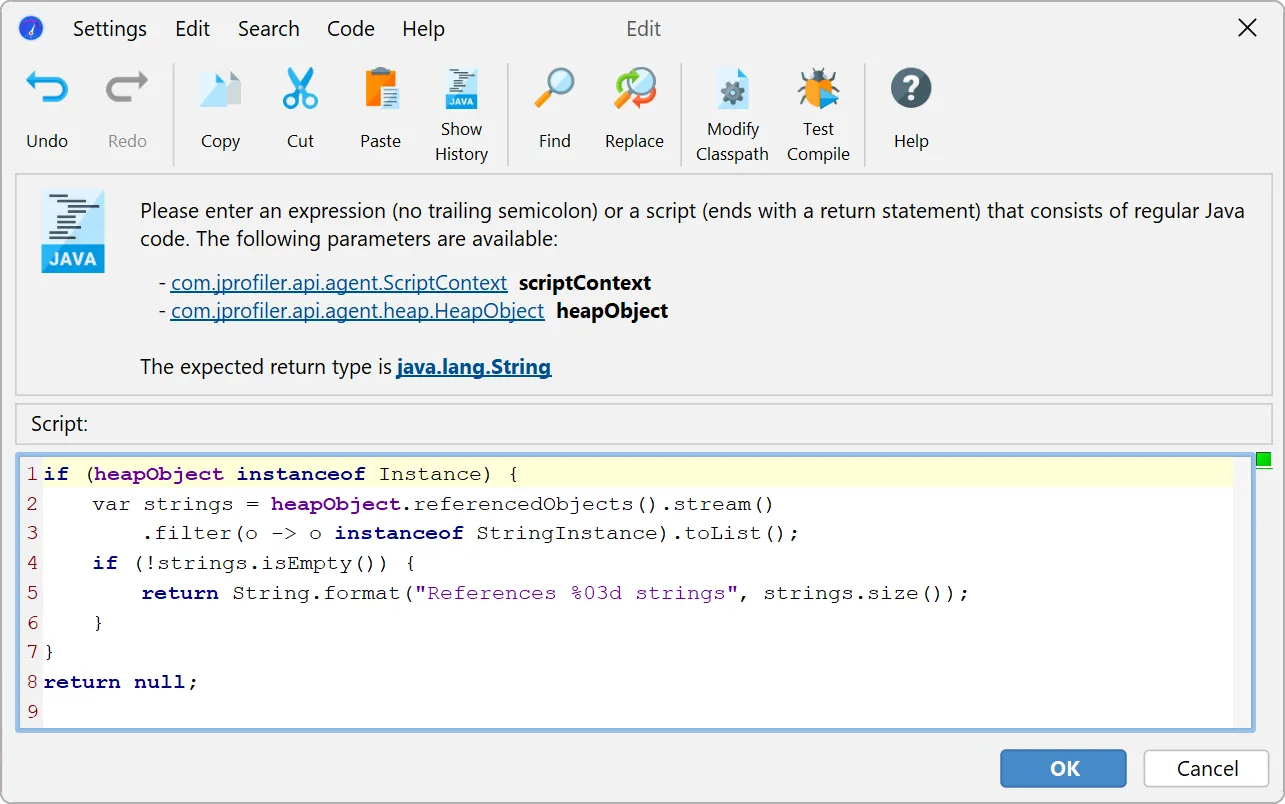
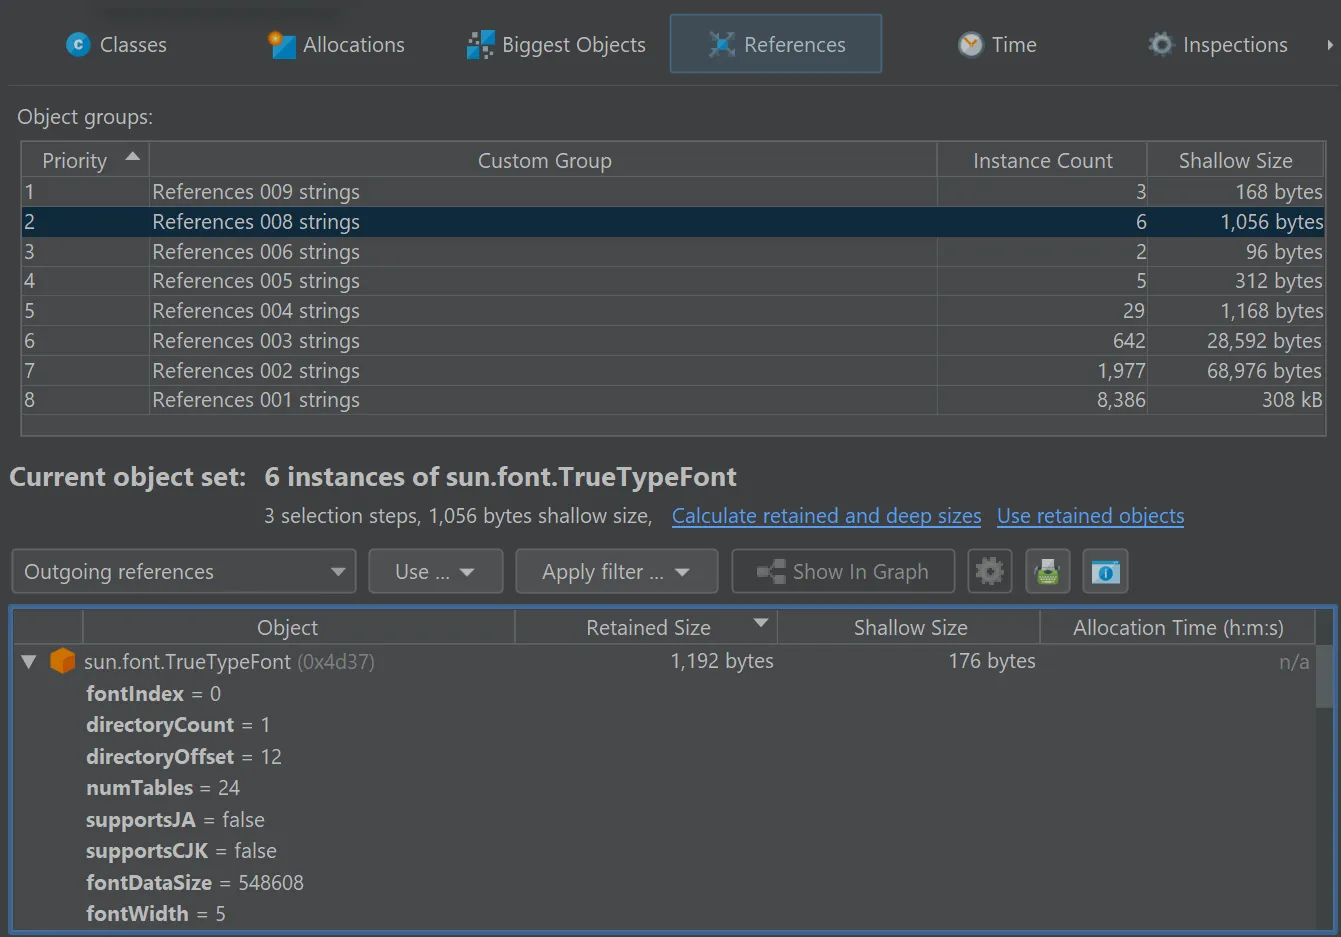
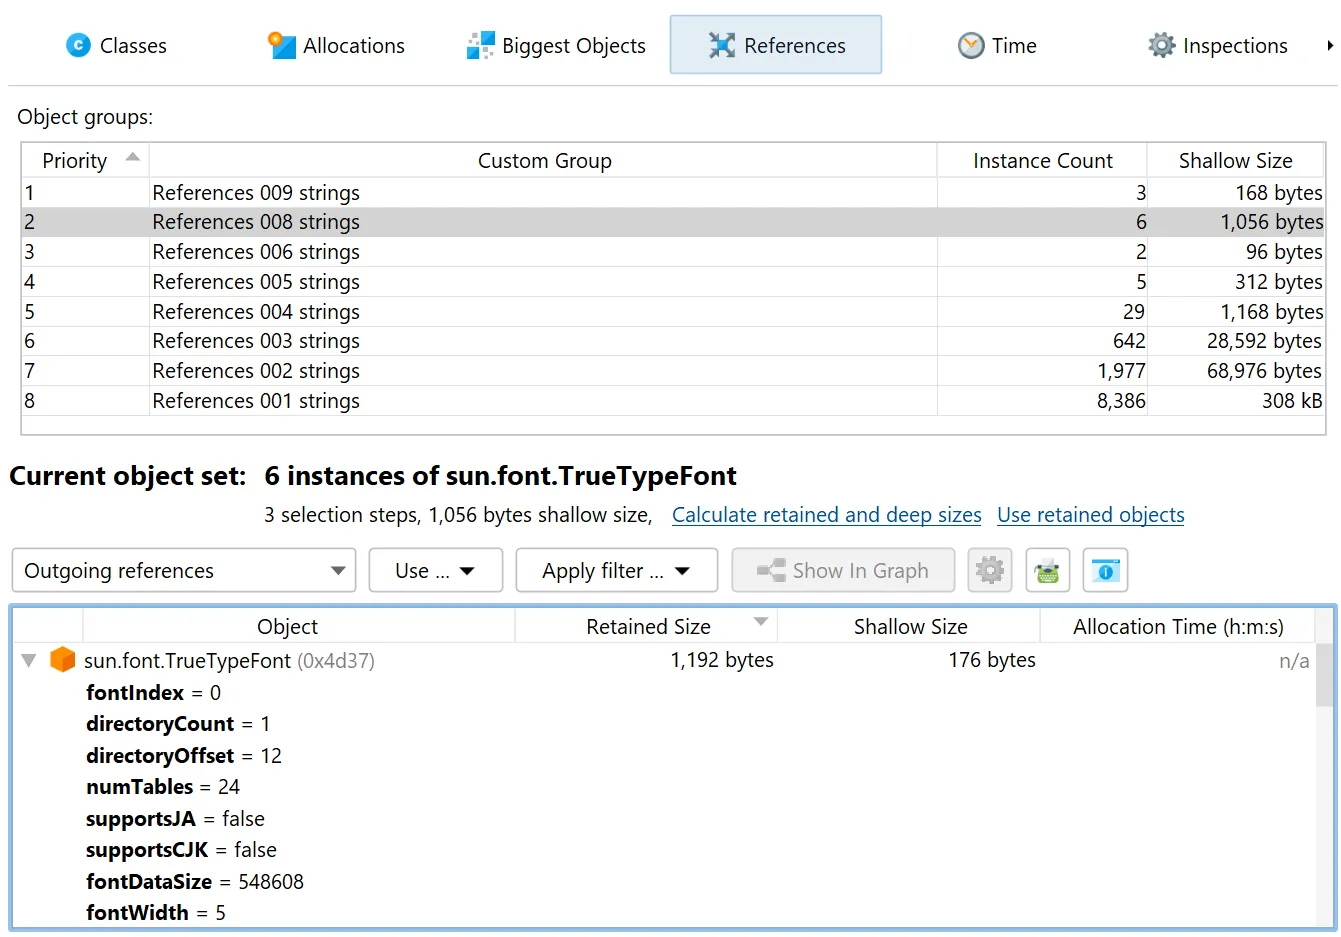
In the "Custom grouping on dumped data" script below, all regular instances are grouped by the number of strings that they reference.
If the passed object is not a regular instance or if it does not reference any strings, the script returns null and the object
is not included.
As for other kings of groupings, a grouping selector is shown at the top after the inspection has been calculated. When you select a group
row, the current heap walker view will only show the instances that are contained in that group.
JProfiler 15 makes it easier to see which views contain data.
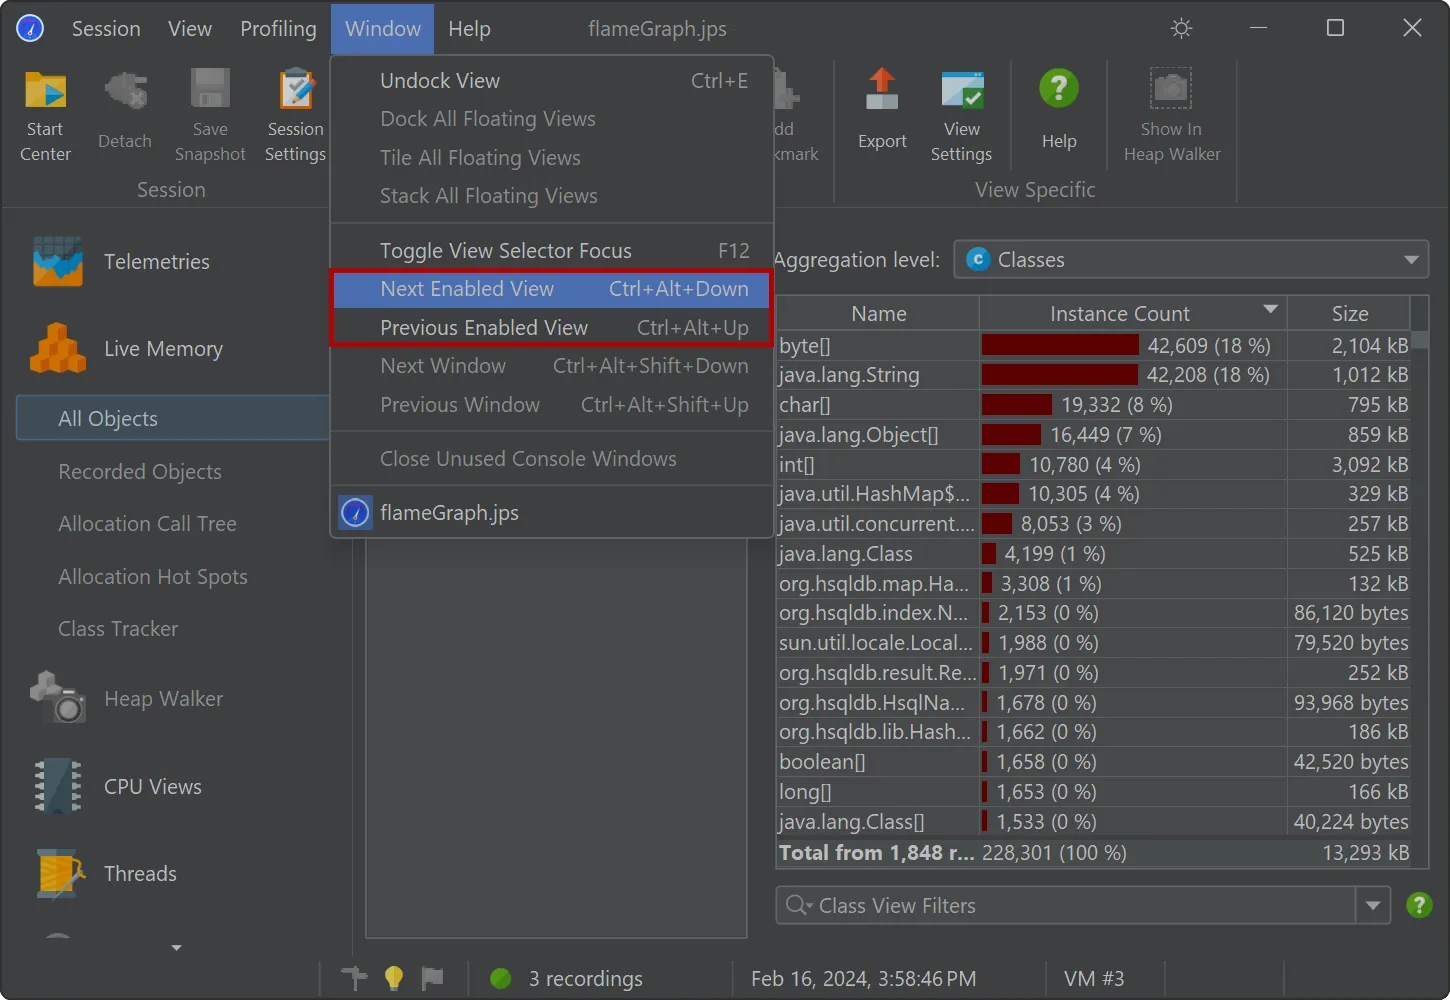
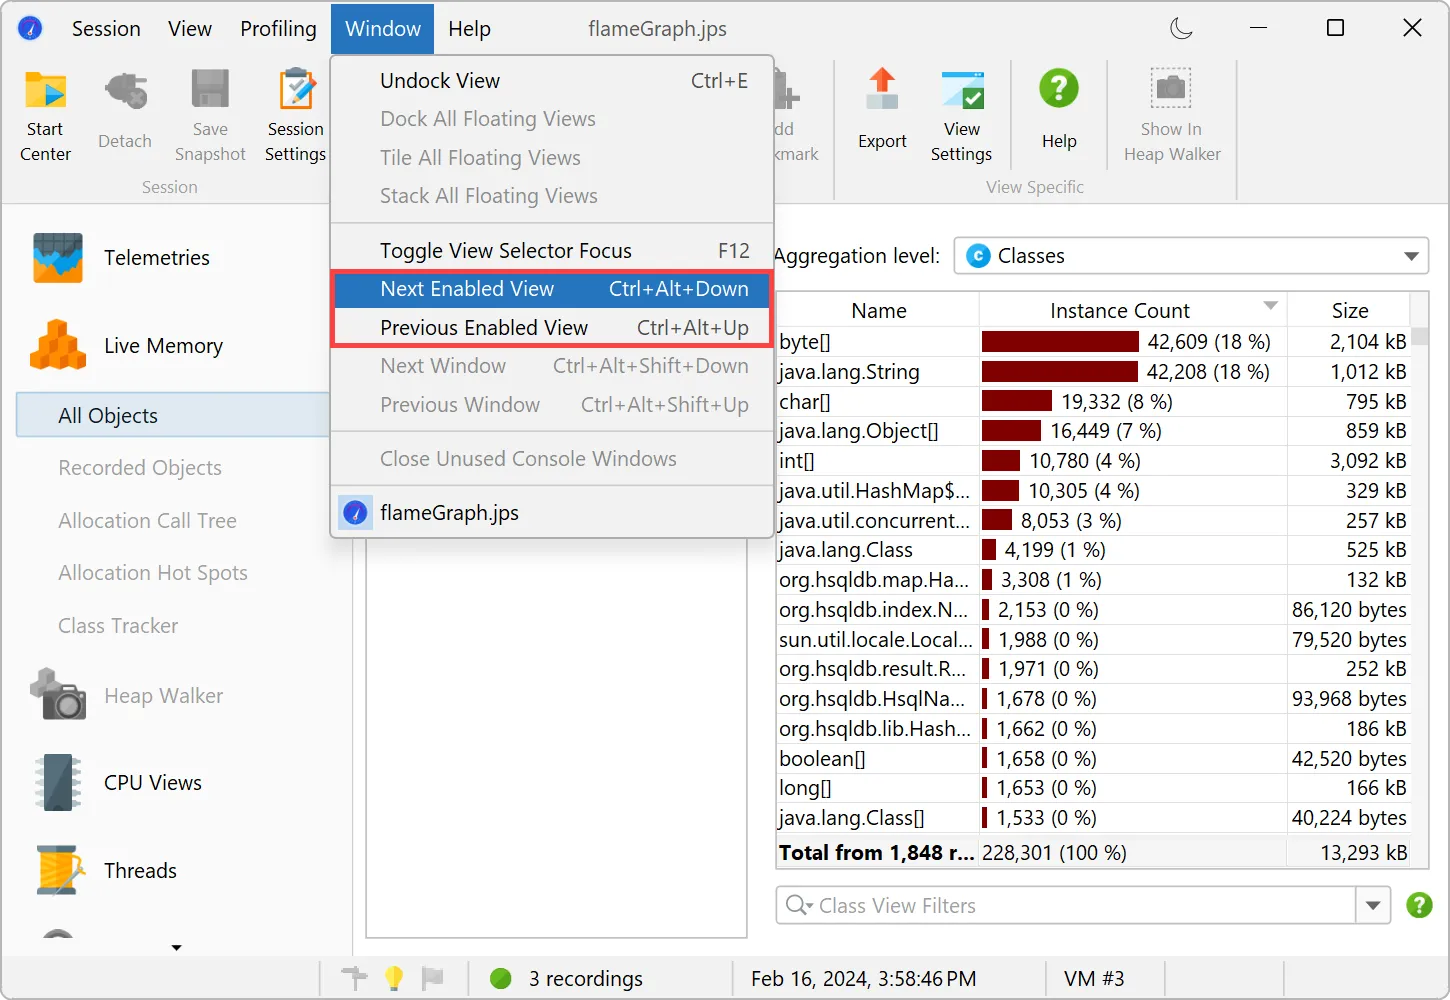
For snapshots, all views without recorded data are now shown as disabled in the view selector.
With the new "Next enabled view" and "Previous enabled view" actions, you can quickly step through all relevant views.
For live sessions, the views displaying recorded data now have a special marker in front of the view name.
A Japanese locale has been added. こんにちは、日本!
The UI as well as the documentation have been fully localized into Japanese.
The language can be changed in the general settings and will be auto-detected by the installer.
A Korean locale has been added. 안녕하세요, 한국!
The UI as well as the documentation have been fully localized into Korean.
The language can be changed in the general settings and will be auto-detected by the installer.
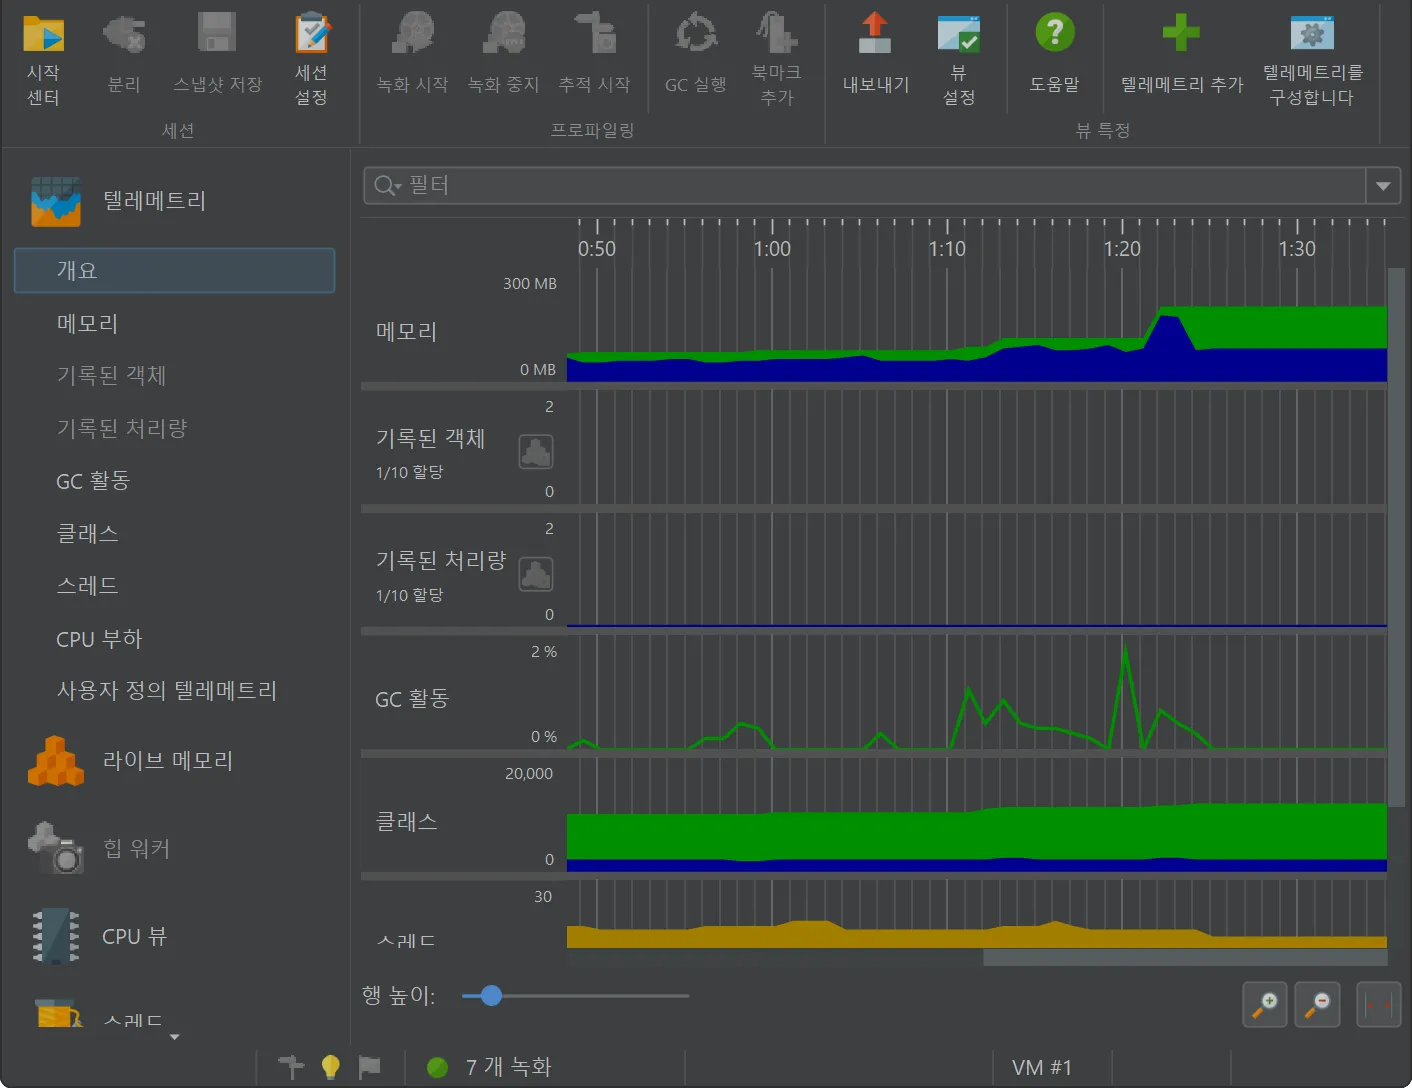
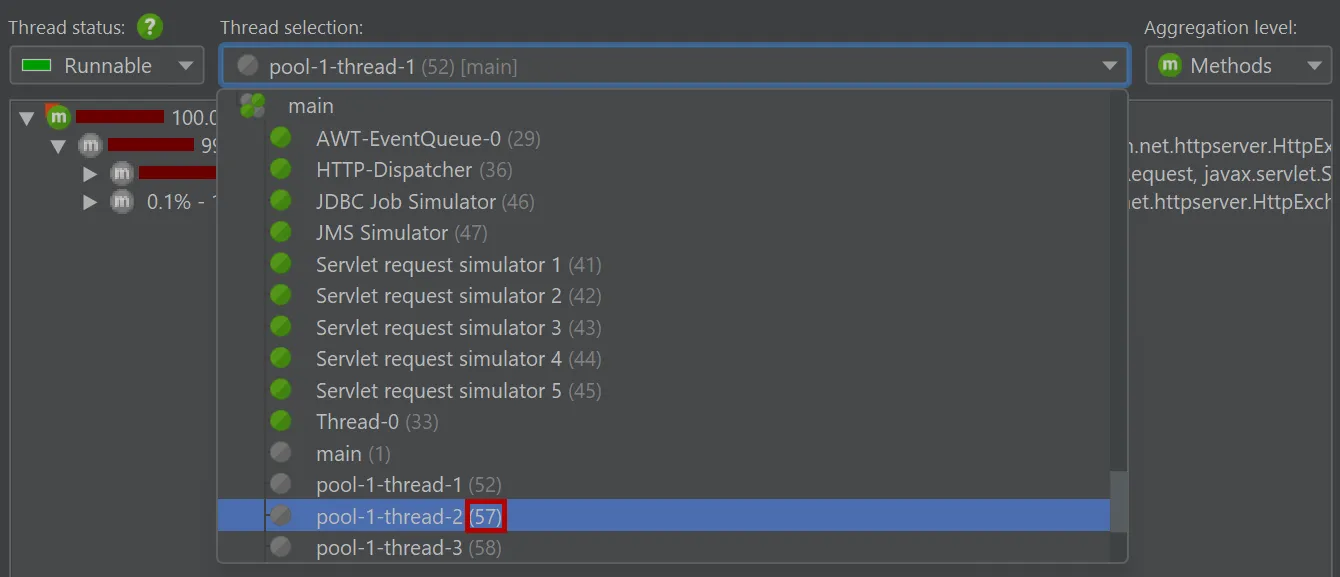
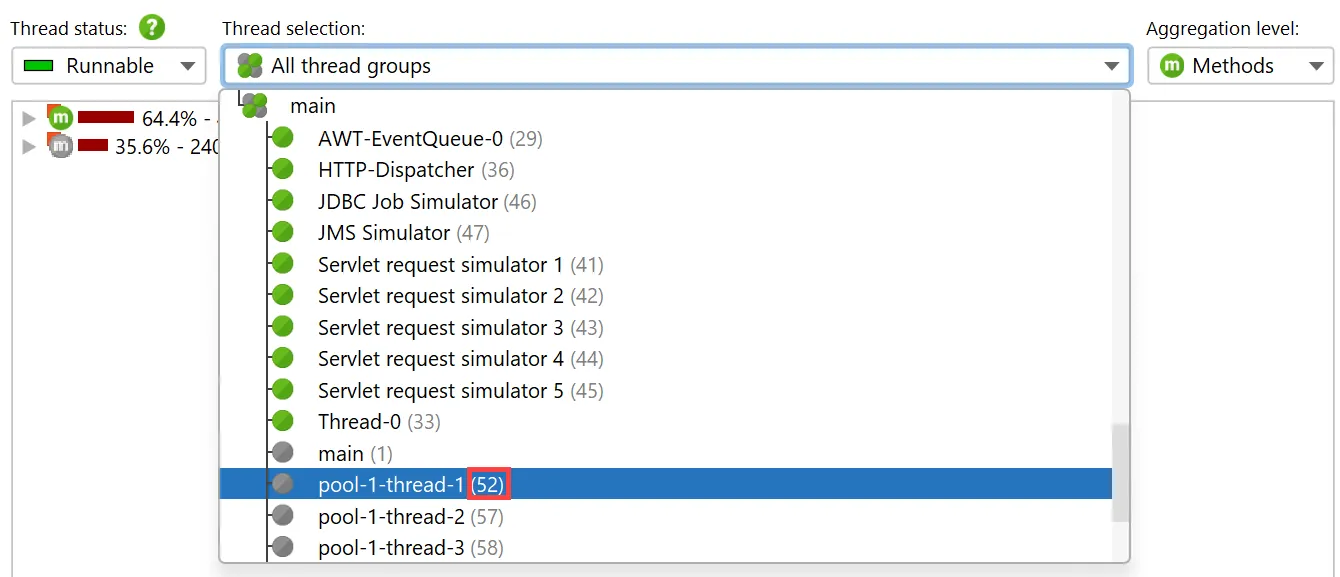
Thread IDs are now shown in the UI.
Previously, only thread names were displayed which are not necessarily unique. Now the unique ID of each thread is added, so that
you can identify particular threads under all circumstances.
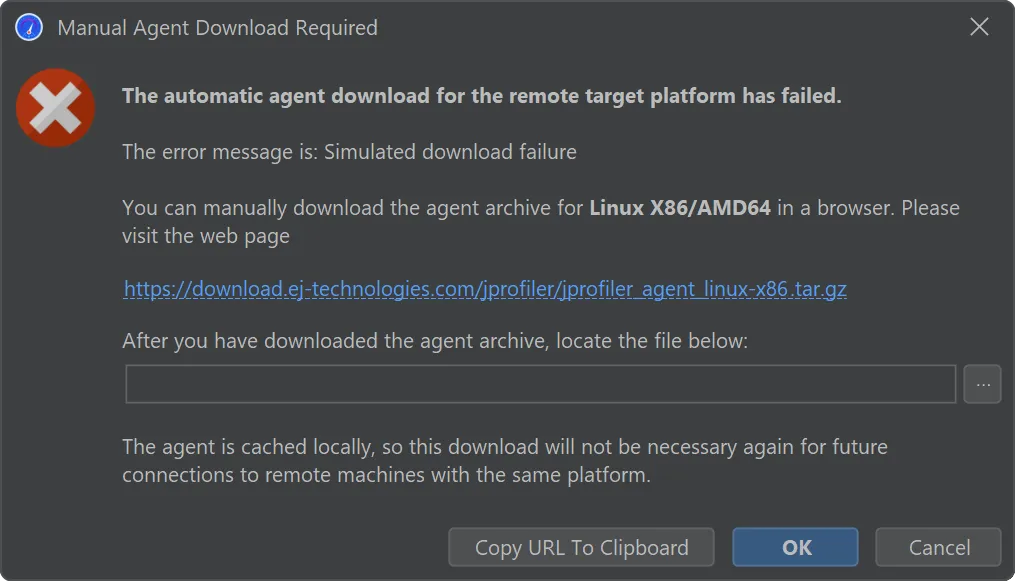
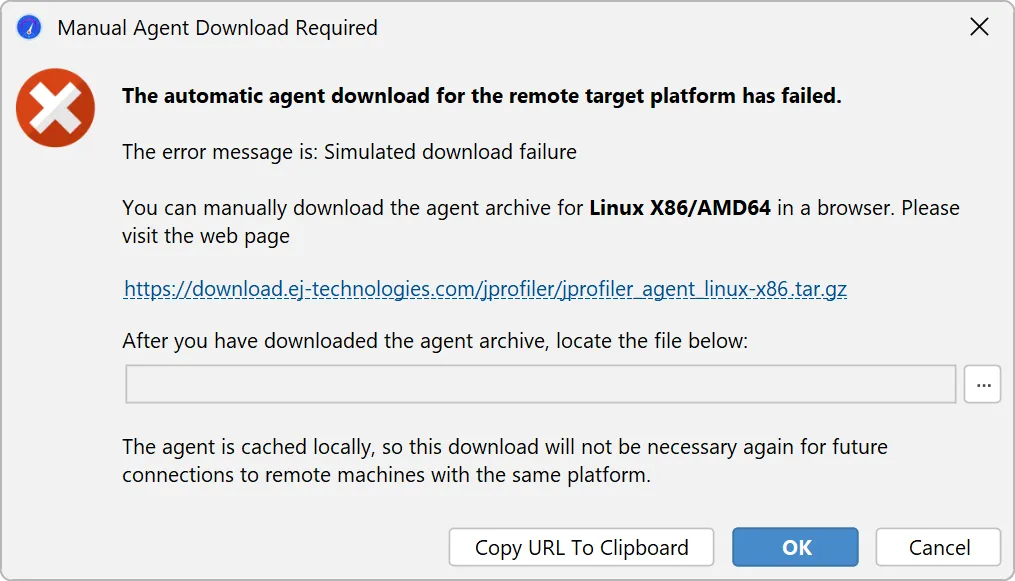
The process for handling a download failure of JProfiler agent archives for remote profiling has been improved.
During a zero-configuration remote attach operation, JProfiler needs to upload the profiling agent for the remote platform.
If the agent for the remote architecture is not available, JProfiler will download and cache it locally. In the case of restrictive
firewalls, such a download may not be possible.
While previous workarounds were cumbersome, JProfiler 15 now offers a workflow for procuring the agent archive with a browser and
telling JProfiler about the externally downloaded archive.