What's new in JProfiler 3.2
Change release:
Please see the change log for a detailed list of changes.
JProfiler 3.2 introduces the following notable new features:
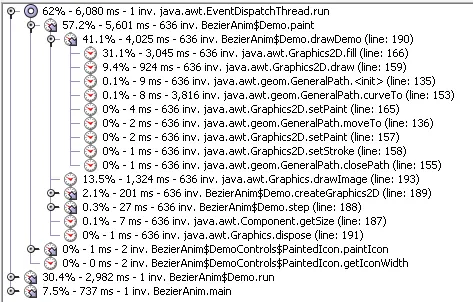
Optional line number resolution in call trees and hotspot backtraces. If
line number resolution is enabled, the invocation tree and the hotspot views show
separate method nodes if one method calls another method multiple times from different
lines of code. The line number indicates the originating call in the
parent node.
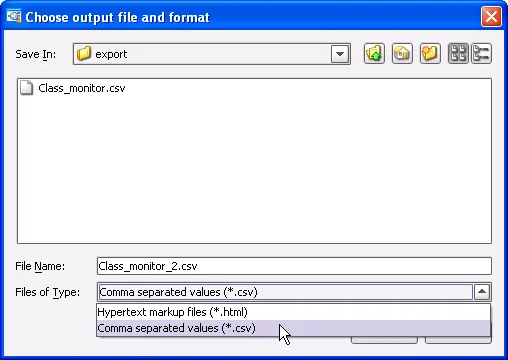
Export views to CSV data and XML. Tabular views and graphs with a time axis can
be exported to CSV data while tree views can be exported to an XML format. Simply
click on the export button and choose the desired format in the file chooser.
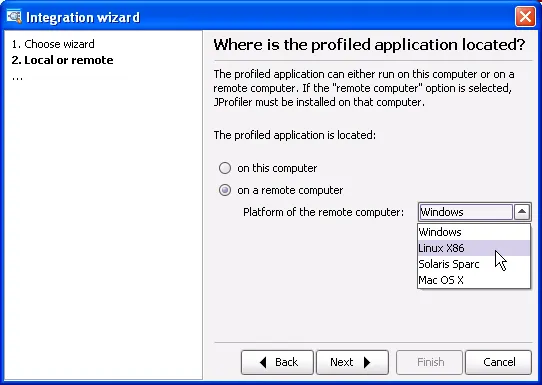
The integration wizards for application servers now support
profiling on remote computers. The second step of each integration wizard asks
you if the profiled application is on the local or on a remote machine.
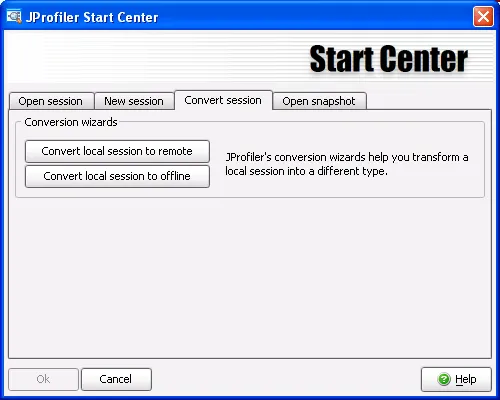
If you want to convert a local session to remote session or to
an offline profiling sessions, there are now wizards in JProfiler that
assist you with this task.
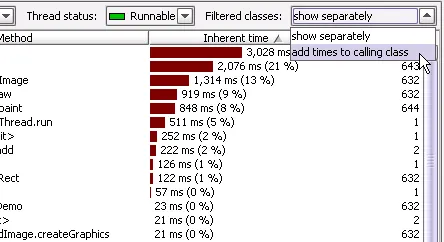
All hotspot views now have a combo box at the top right corner
where you can choose how to treat filtered classes in the hotspot calculation.
The previous default mode was to treat filtered classes separately, now you
can also add filtered classes to the calling class. In that way, you can reduce
your viewpoint exclusively to your own code.
In the reference graph of the heap walker, instances have now plus and minus icons
for outgoing and incoming references. With the minus icon, references can now be hidden.
When you hide references, all instances without a connection to the central object will
be hidden, too. These icons allow you to quickly
show and hide referenced and referencing objects. They also give you an indication
which references have been expanded so far.
In the method graph, methods now have a plus icon for incoming and outgoing calls.
The plus icon gives you an indication whether calls have been expanded so far.
Also, you can now select one or multiple method nodes and hit the "Delete"
key to hide them from the graph.
In the reference graph of the heap walker, you can now search for an arbitrary number
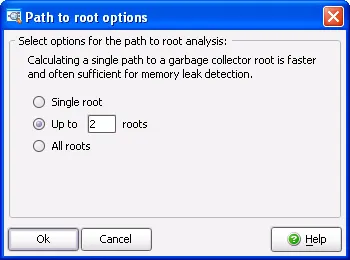
of garbage collector roots. When you invoke the "Show paths to GC root" function
in the reference graph, the option dialog now presents an "Up to n roots" option.
When a single root does not produce the desired results, try adding one
more root at a time.
