- Java 7 requires profiling agents to update pre-verification information. This applies to code that is compiled with -target 1.6 and above. This also speeds up class-loading with Java 6.
- The new "invokedynamic" bytecode in Java 7 is now handled by JProfiler.
What's new in JProfiler 6.1
Change release:
Please see the change log for a detailed list of changes.
JProfiler 6.1 introduces the following notable new features:
Full Support for Java 7. The main changes are:
Much better support for loading extremely large snapshots.
- Both JProfiler heap dumps as well as HPROF snapshots are loaded and analyzed up to twice as fast.
- It is now possible to skip the retained size calculation if it is taking too long.
- Many operations in the heap walker are now much faster than before, especially in the biggest objects view and the reference views.
- The handling of out of memory conditions is much improved and shows useful warning and error messages.
- The heap analysis on 32-bit JREs in cases where the object index did not fit into memory and had to be swapped to disk has been sped up dramatically.
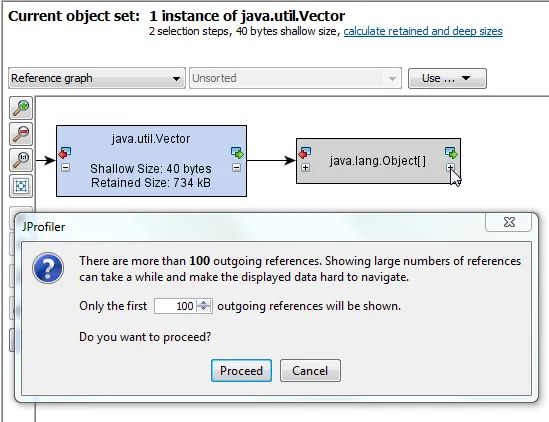
- Operations that would show a large number of references, potentially overwhelming the JProfiler GUI are now truncated with a user-configurable cap.
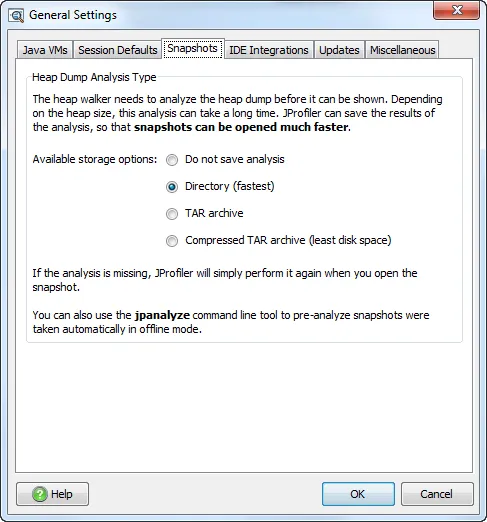
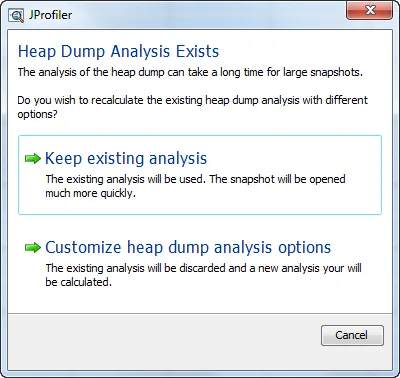
The heap analysis is now stored for future use.
Most of the time spent when loading snapshots is for the analysis of the raw data, the removal of
unreferenced objects and the retained size calculation. JProfiler now stores the result of this analysis
next to the snapshot if possible. This means that opening a snapshot that has already been analyzed
is now orders of magnitudes faster. You can customize the storage format for the analysis in the
general settings.
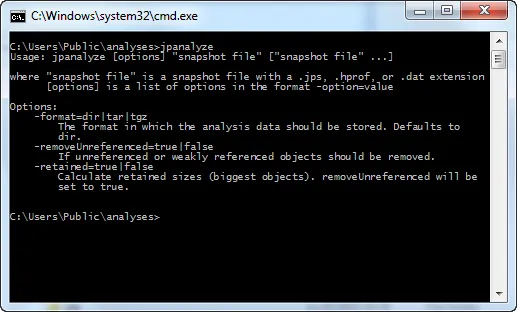
Snapshots taken with offline profiling do not have an existing heap analysis. If you're taking these snapshots
in an automated fashion, you can use the new command line tool jpanalyze in order to massively speed up
the opening of these snapshots in the JProfiler GUI.
Set the heap analysis options when opening a snapshot. Previously, the heap analysis options,
such as the removal of unreferenced objects or the retained size calculation were saved with the snapshot.
Now, these default settings can be changed when opening a snapshot.
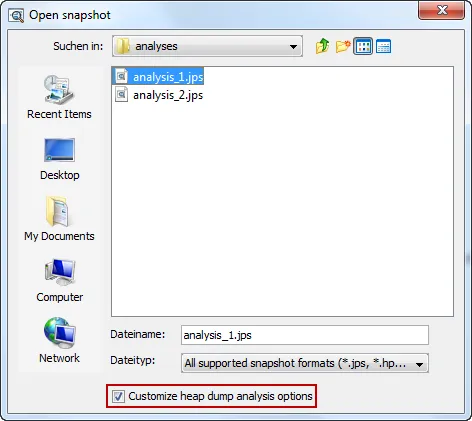
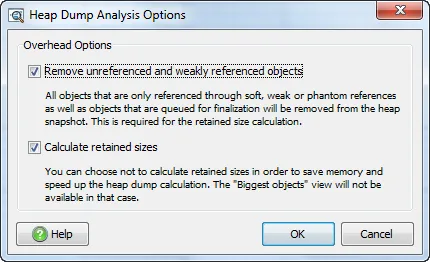
This also allows you to modify a stored heap analysis later on.
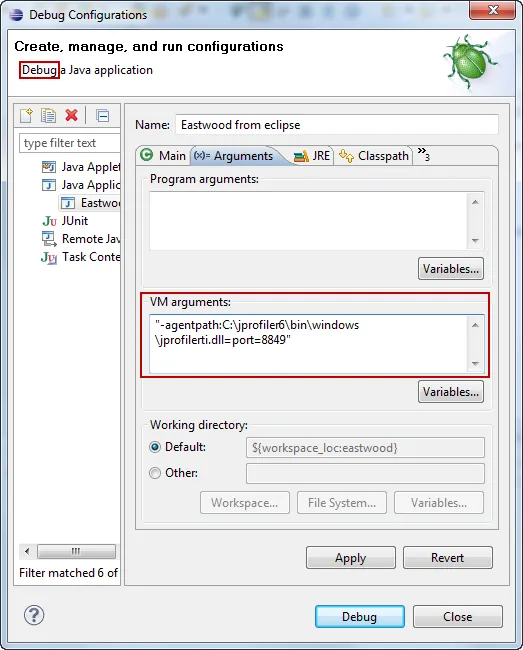
Support for debugging and profiling at the same time. Debugging and profiling at the same time
was not possible with instrumentation in earlier versions since some class file attributes that are important
for debugging were not modified as required. From this version on, the combined operation is supported.
Because the IDE integrations do not support this directly, just invoke Session->Integration Wizards->New Remote Integration
and add the advised VM parameter to the debug configuration in your IDE.
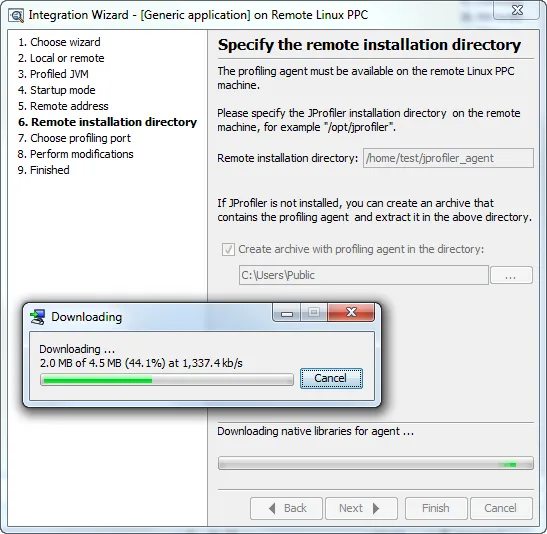
Creation of archives with the profiling libraries for remote platforms. For remote profiling,
the standard advice in the integration wizards is to install JProfiler on the remote system. Even easier, you can
now create an archive that contains all required profiling libraries for the selected target platform.
If the required libraries have not been installed locally, they will be downloaded first.
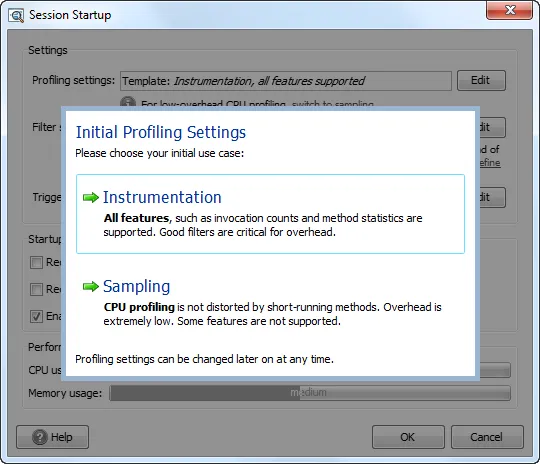
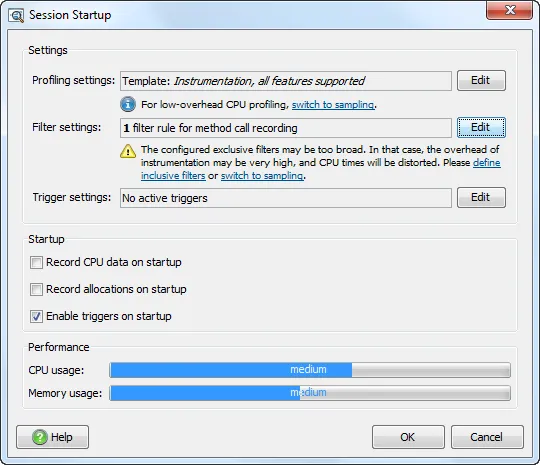
Sampling vs. instrumentation. The decision of whether to use sampling or instrumentation for CPU profiling
is very important. The session startup dialog now asks you for the initial setting, explaining the advantages
and disadvantages of both modes. In addition, the session startup dialog now shows you hints about potential problems
with your profiling settings including quick links in order to fix them.
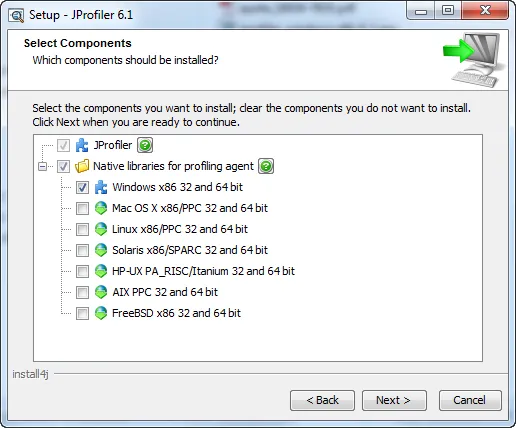
Improved installer. The installation has been streamlined and provides a better user experience.
You can now download and install profiling libraries for other platforms directly in the installer.
Support for IDEA X (current EAP build) and Netbeans 6.9 The plugins are now bundled with JProfiler.