What's new in JProfiler 8.1

Change release:

Please see the change log for a detailed list of changes.

JProfiler 8.1 introduces the following notable new features:

Very large heap snapshots can be opened and analyzed with far less physical memory than in previous versions. In this release, we have rewritten the heap walker backend with a focus on extreme use cases.

Because JProfiler now uses native memory for large memory blocks, no -Xmx tuning is required to open huge snapshots.
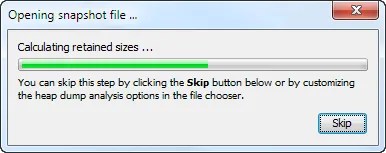
Another benefit of the new heap walker backend is a much faster analysis of heap snapshots. For large snapshots the speedup can be dramatic.

Screenshot

Finally, re-opening a snapshot that has already been analyzed is now very fast.

HPROF is now a first-class heap dump method in JProfiler.

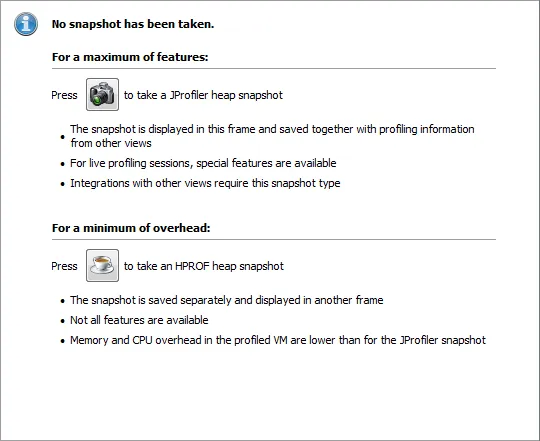
HPROF snapshots can be written internally by the JVM with very low overhead. The heap walker overview page now offers the JProfiler heap snapshot for a maximum number of features, and the HPROF method for a minimum of overhead.

The HPROF snapshot will be transferred to your local machine if necessary and opens in a separate window.

Screenshot

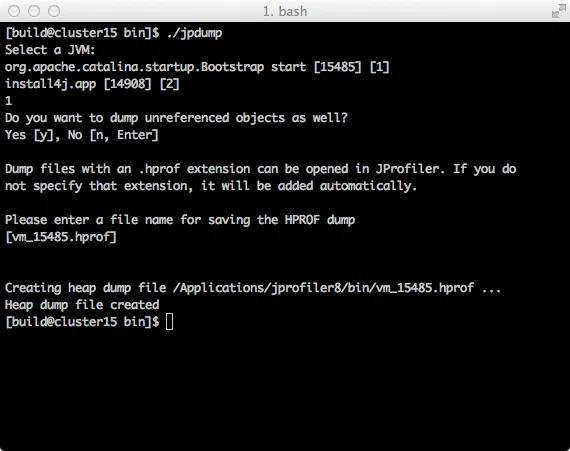
To take HPROF snapshots from the command line, the command line executable jpdump has been added.

While it is possible to extract HPROF snapshots with tools contained in the JDK, jpdump is interactive, much more user-friendly and does not require a JDK.

In addition, it can handle two situations where the JDK tools fail: First, you can extract an HPROF snapshot from a Windows service and second, a 32-bit/64-bit mismatch between the JVM that is used by jpdump, and the JVM of the target process are handled transparently.

Below, you can see a typical session with the jpdump command line tool.

Screenshot

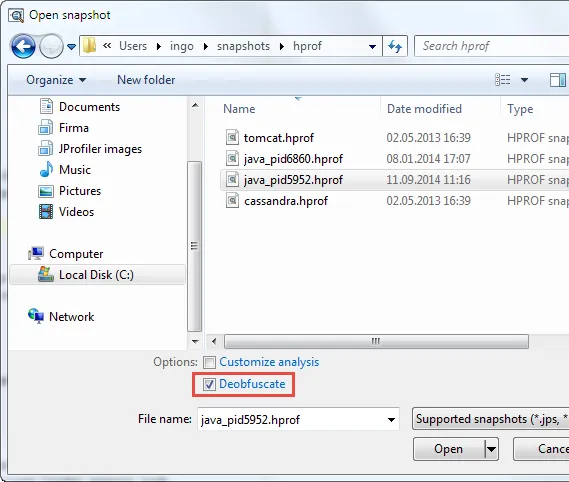
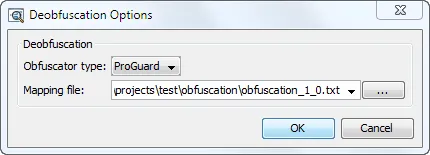
Obfuscated snapshots can now be deobfuscated when they are loaded by JProfiler.

In the file chooser, you can select the "Deobfuscate" option and subsequently specify a mapping file for ProGuard or yGuard. All displayed packages, classes and methods will then be shown with their original names.

Screenshot
Screenshot

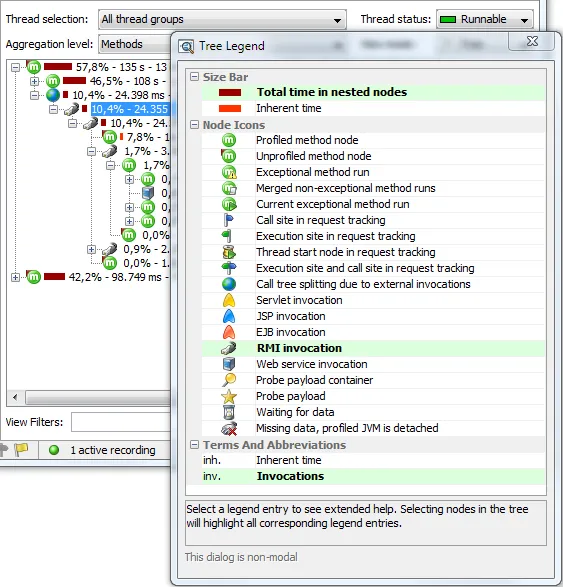
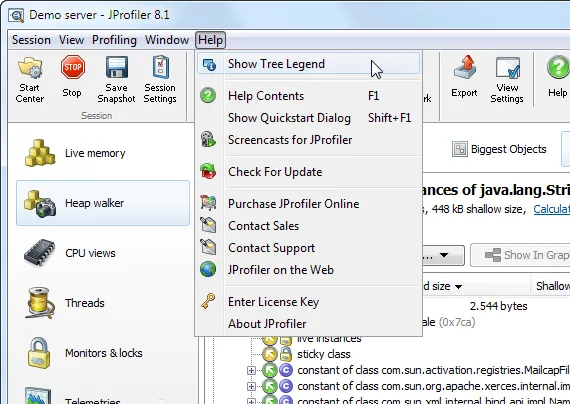
Dynamic tree legends explain all icons, abbreviations and special terms that can occur in the active tree view.

Previously you had to consult the help and locate the information you were looking for. Now, the tree legend window shows you the matching entries for the selected tree node in bold.

When you select an entry, further explanations will be shown at the bottom of the legend.

Screenshot
The legend dialog is non-modal and can be activated from the tool bar or from the help menu where available.
Screenshot

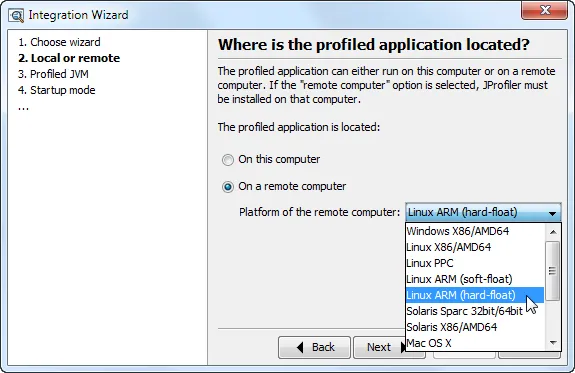
A lot of interesting things are happening in the ARM world, and Java is on track to support an ever-increasing number of ARM variants. In this release, we have added Linux ARM hard float as a new platform for profiling.

The corresponding binaries are located in the bin/linux-armhf directory of all Linux installers and archives.

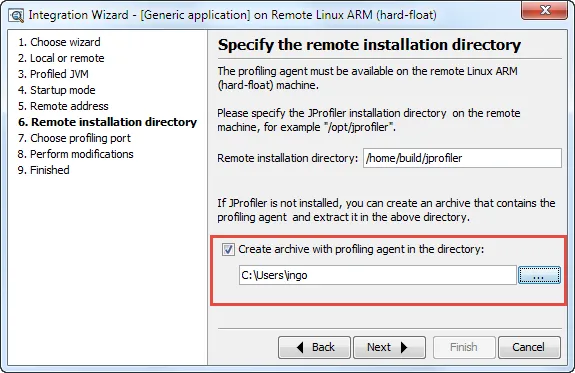
From other platforms you can prepare a .tar.gz file with the profiling agent by selecting "Linux ARM (hard float)" as the target platform in any integration wizard and choosing to create the archive in the "Remote installation directory" step of the wizard.

Screenshot
Screenshot