|
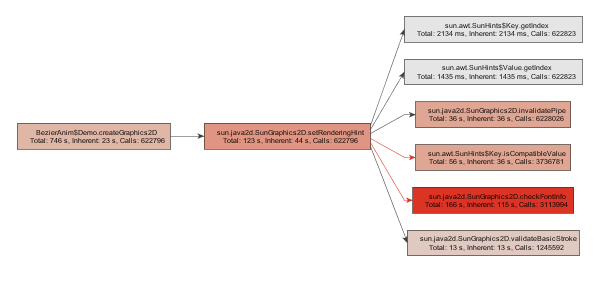
The call graph shows a statically calculated
thread resolved
call graph for selected nodes. The nodes are methods, classes, packages, or Java EE components,
depending on the selected aggregation level.
To calculate a call graph, click
Before a graph is calculated, the
call graph wizard
is brought up. The resulting graph is static and can be re-calculated be executing
|
 Generate
graph in the tool bar or select View->Generate Graph
from JProfiler's main menu. If a graph has been calculated, the context menu also
provides access to this action.
Generate
graph in the tool bar or select View->Generate Graph
from JProfiler's main menu. If a graph has been calculated, the context menu also
provides access to this action.
The call graph has the following properties:
If applicable, an node has plus signs at the left and the right side to show or hide
calling and called nodes. The controls at the left side are
for calling, the controls at the right side for called nodes. The plus signs have the same effect
as the
The first time the outgoing calls of a node are expanded, only calls above the threshold that is
configured in the view settings are displayed.
If there still are outgoing calls below below the threshold, a
You can hide nodes by selecting them and pressing the delete key. You can select
multiple nodes and delete them together. Alternatively, you can select the
If you delete methods, the call graph may contain a number of unconnected branches.
To clean up the graph, select a method on the branch that should be retained and select the
Any modification to the call graph can be reverted with the
The call graph offers a number of navigation and zoom options. |
 Show calling nodes
 Show called nodes
 Add nodes to graph,
to add other unrelated nodes to the graph.
The
Add nodes to graph,
to add other unrelated nodes to the graph.
The  shaded icon is shown on the right side.
If you expand again, all outgoing calls are displayed.
shaded icon is shown on the right side.
If you expand again, all outgoing calls are displayed.
 remove nodes from graph
action from the graph toolbar or the context menu.
remove nodes from graph
action from the graph toolbar or the context menu.
 cleanup unconnected methods
action from the graph toolbar or the context menu. The "remove all but selected nodes" action in the
context method allows you to trim the graph to a few selected nodes.
cleanup unconnected methods
action from the graph toolbar or the context menu. The "remove all but selected nodes" action in the
context method allows you to trim the graph to a few selected nodes.
 undo action. If you open a large number of
calls and want to track back to a previous state of the graph, hit this button repeatedly.
If you hit undo too may times, a
undo action. If you open a large number of
calls and want to track back to a previous state of the graph, hit this button repeatedly.
If you hit undo too may times, a |
The call graph offers several analyses that produce static snapshots
with calculated information related to the selected method. The results are shown in nested views and are
replaced whenever a particular type of analysis is repeated.
The data is taken from the currently displayed graph and not from the live call tree view, so the displayed time always shows the time when the graph was calculated. Because the graph handles bridge methods and interface method calls specially in order to avoid "bottleneck" nodes in the graph, the call trees displayed by the analyses can be somewhat different from the corresponding analyses in the call tree view. |